How to Upload Document in the ConnectedLife App?

Document upload functionality systems serve a vital role by enabling healthcare providers to maintain comprehensive health records, securely share information, and allow patients/users to contribute relevant documents such as personal health records.

Uploading documents to the ConnectedLife application is described in this article.

Here is the procedure for uploading documents for a user in the app:

  • Step 1: Look for the “+” icon—it’s your ticket to uploading documents.
  • Step 2: Clicking on the “+” icon opens up three options for uploading your documents.
  • Step 3: After selecting your document, a new window will pop up. Simply click “Confirm” to smoothly upload your document.
  • Step 4: Once uploaded, you can easily find your documents in the “All Files” section. Here, you’ll see everything that’s been shared with you, as well as documents you’ve uploaded and downloaded. Easy peasy!

Tips:

  • While uploading the documents, make sure you have a stable internet connection.
  • Once the user uploads a document/photo, it will be shared with the Support Team Members.
  • You can upload PDF files and images (in PNG and JPG format) with a max of 50 MB.

How to Submit AICVD Score as a ConnectedLife App user?

The AICVD Cardiac Risk Score, an innovative artificial intelligence-driven system, delivers a personalised risk assessment for Coronary Artery Disease events over the next decade. This functionality grants a thorough summary of the user’s assessment outcome, supplying crucial insights to inform subsequent analyses and decision-making processes.

The article outlines the process of submitting an AICVD Score as a ConnectedLife App User.

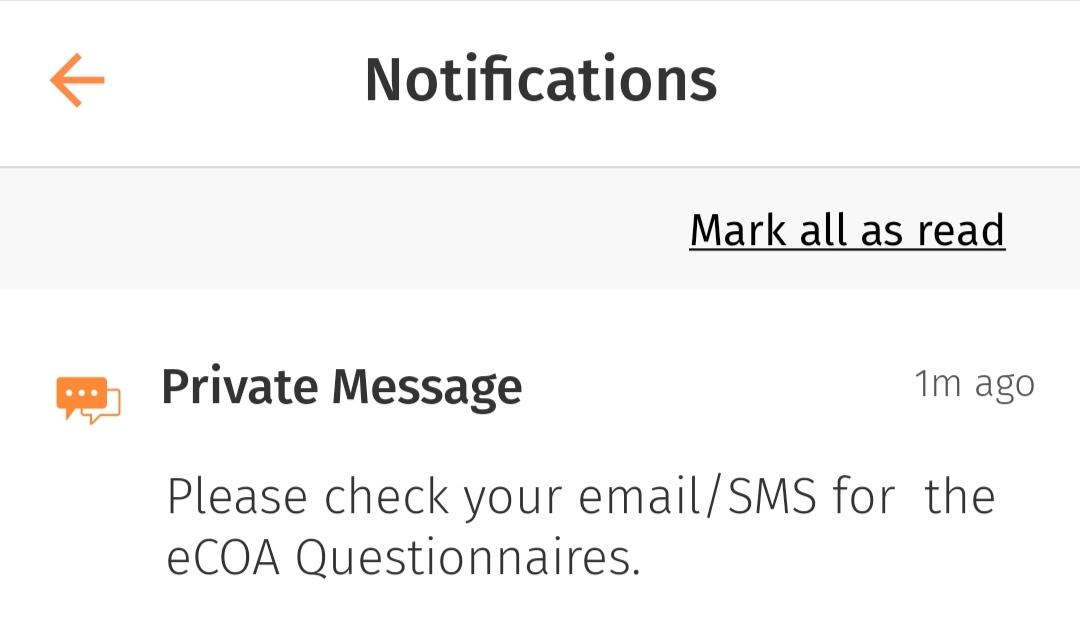
After sending AICVD Screening from the dashboard, the user will promptly receive the notification on the ConnectedLife mobile app.

To submit the AICVD score, please follow the following steps:

Step 1:

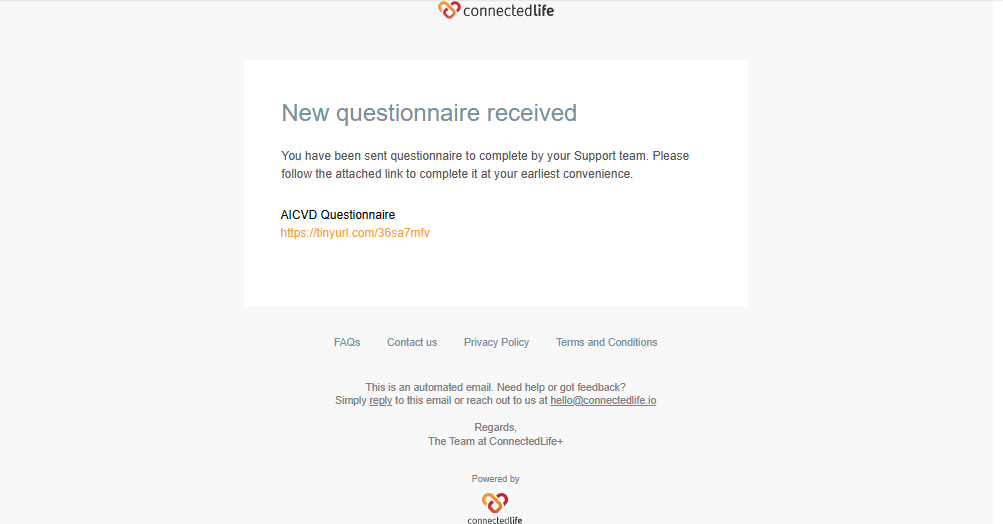
Click on the link you receive via SMS/email.

Phone Number view:

Email View:

Step 2:

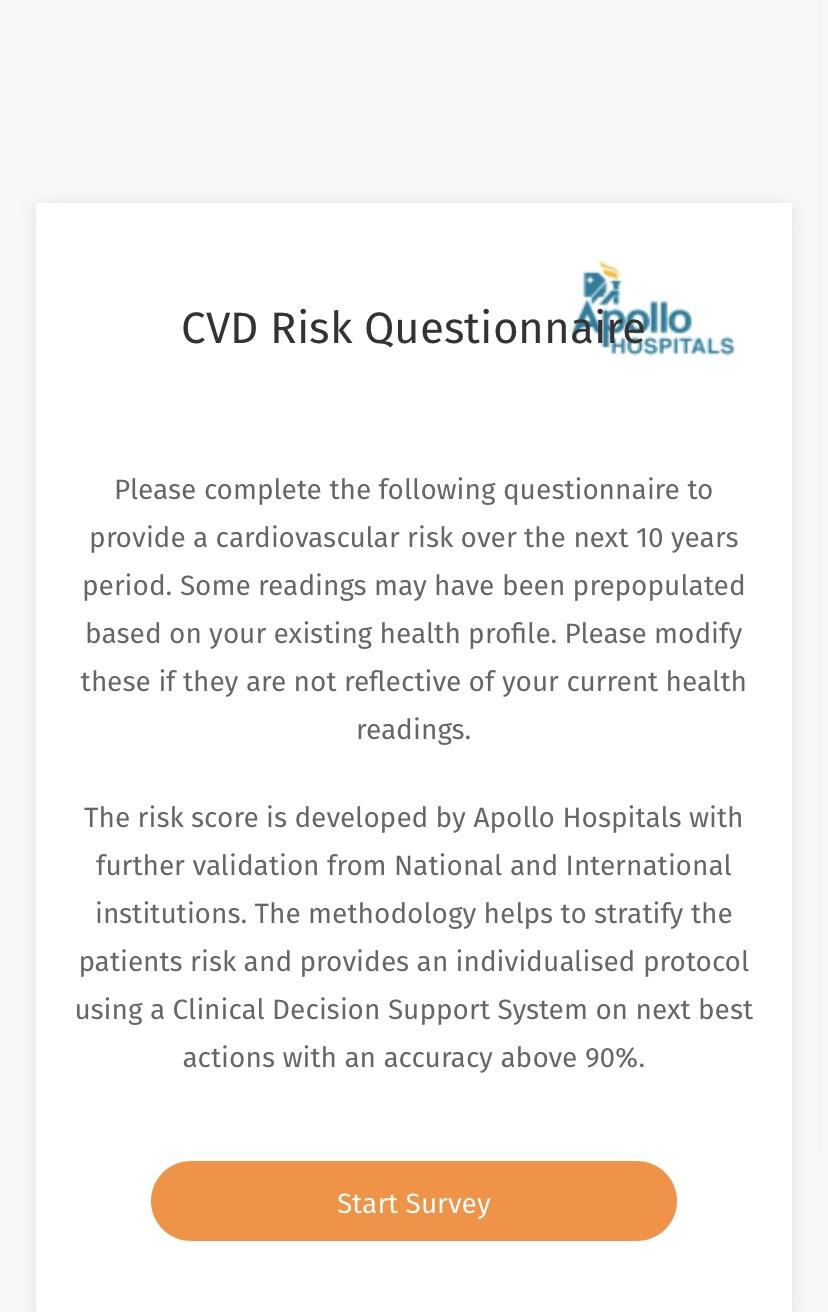
You will see a description of the CVD Risk Questionnaire. Click on the Start Survey.

Step 3:

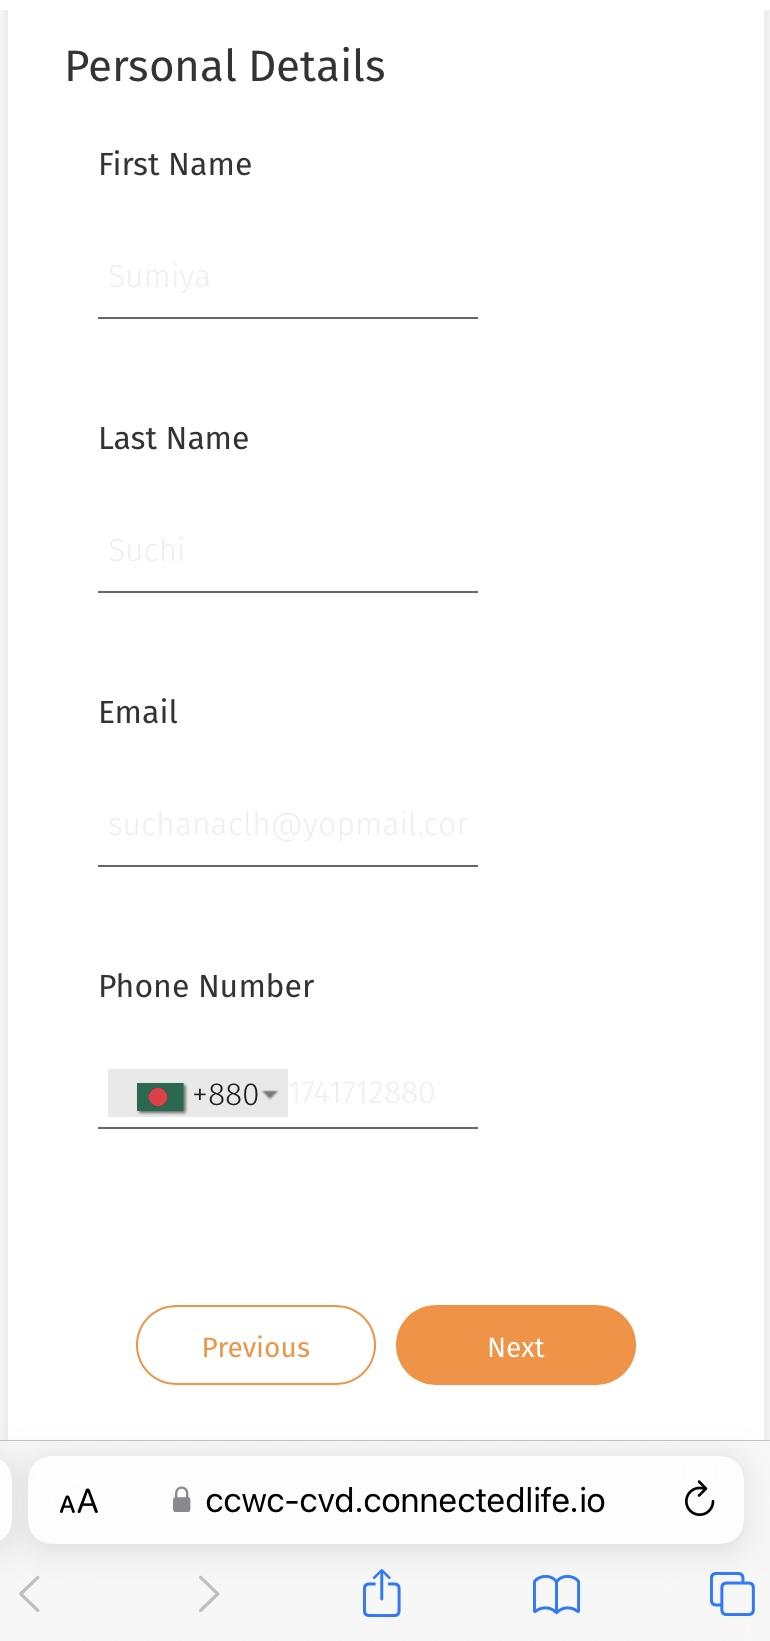
You will see different questions regarding Personal Details such as First name, Last name, Email, and Phone number. It will be auto-filled. Click Next to see the questionnaire.

Step 4:

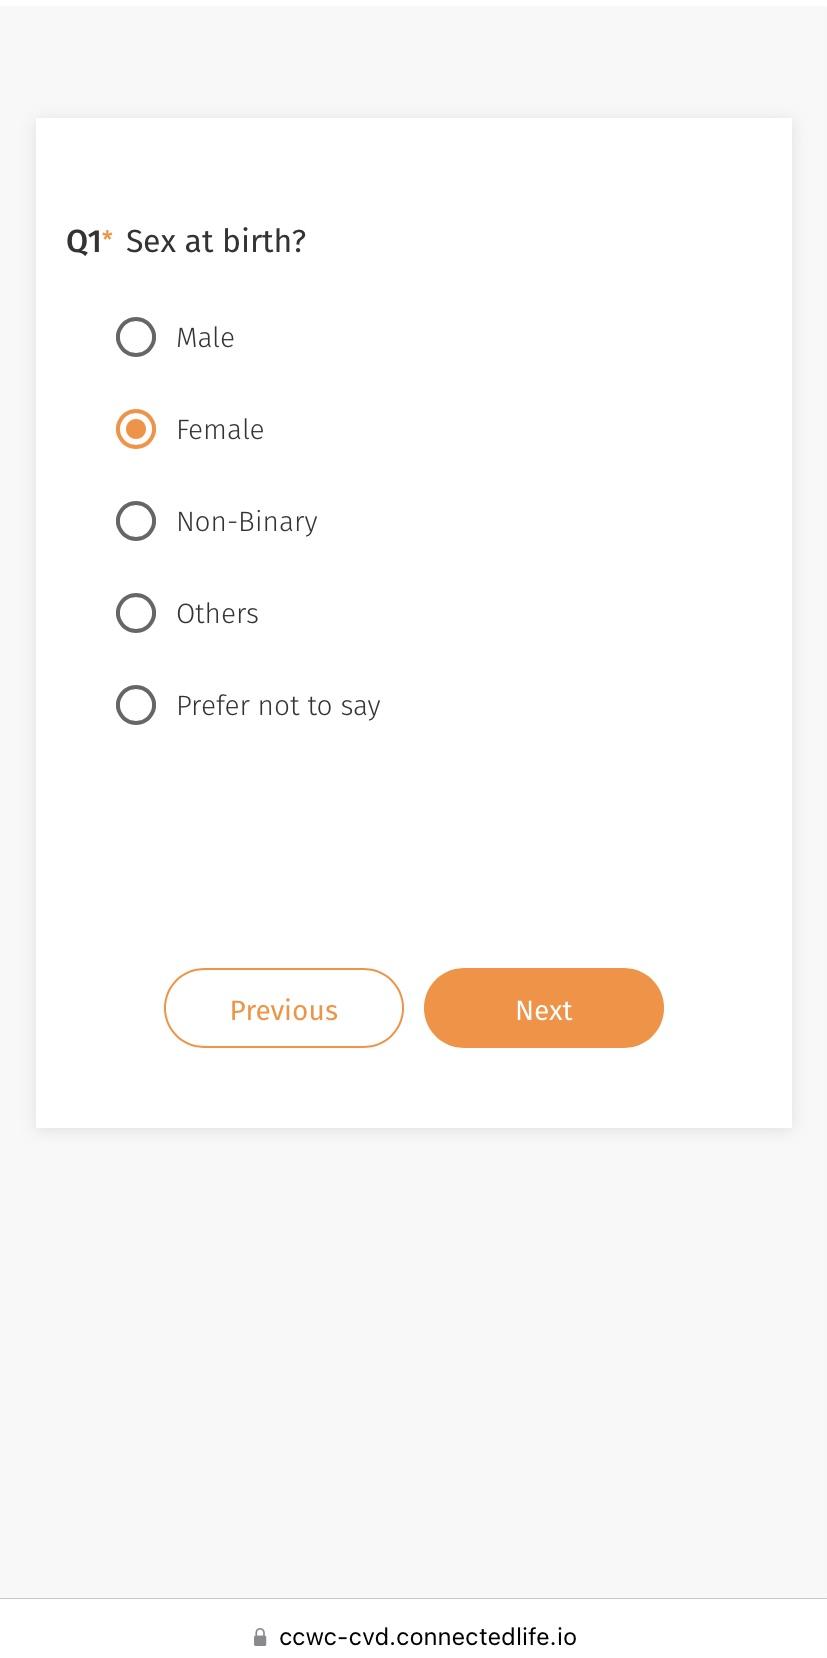
Now a series of questions will start appearing on the screen starting with the following questions.

Click Next to see the following question and Click Previous to see the previous one.

Q1. Sex at birth?

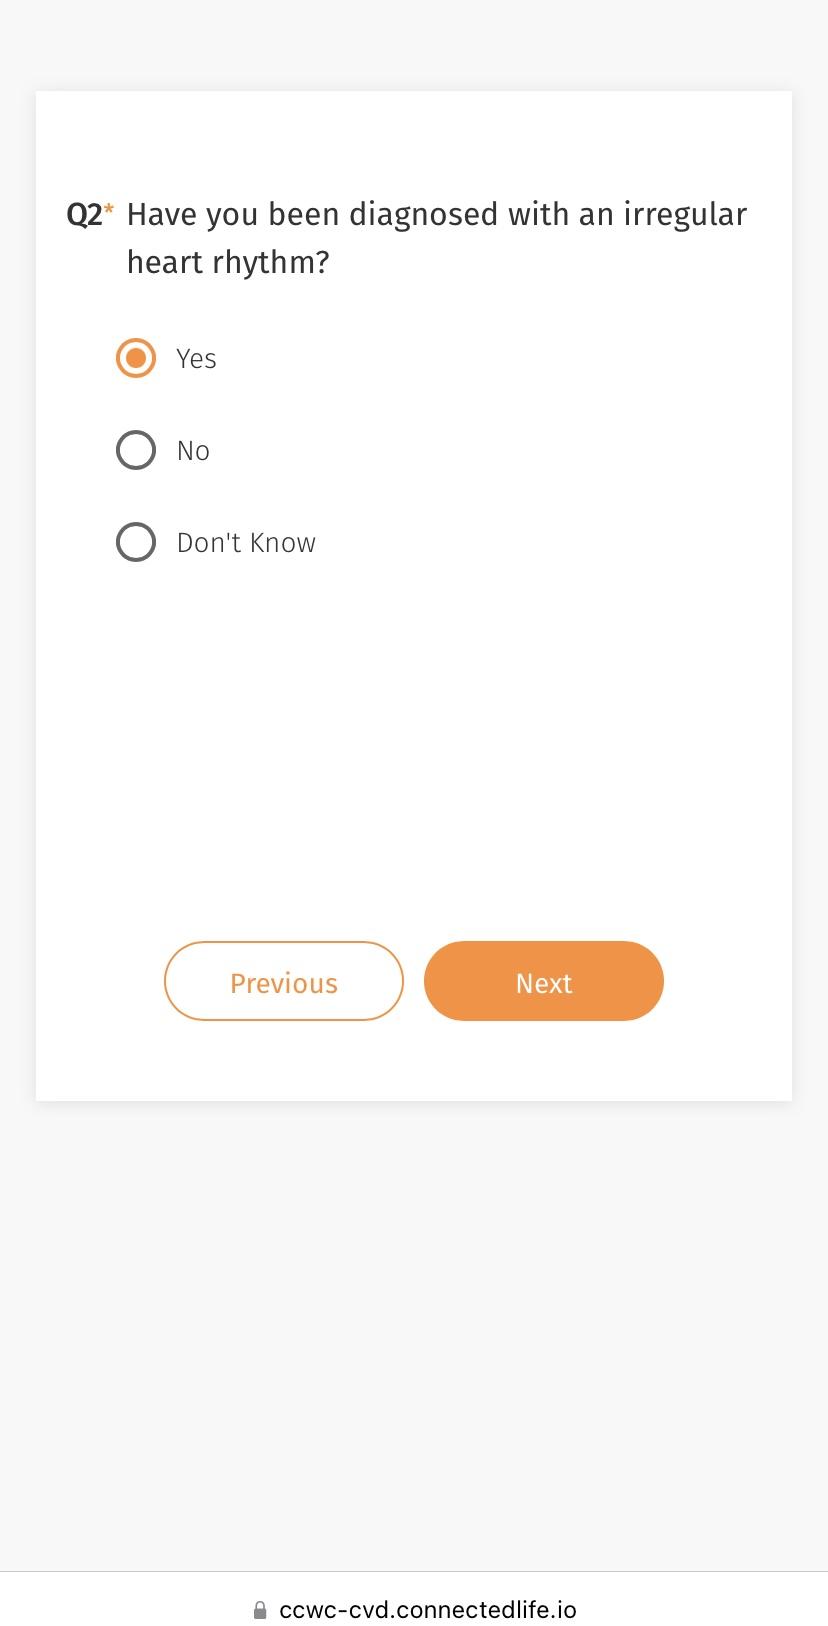
Q2. Have you been diagnosed with an irregular heart rhythm?

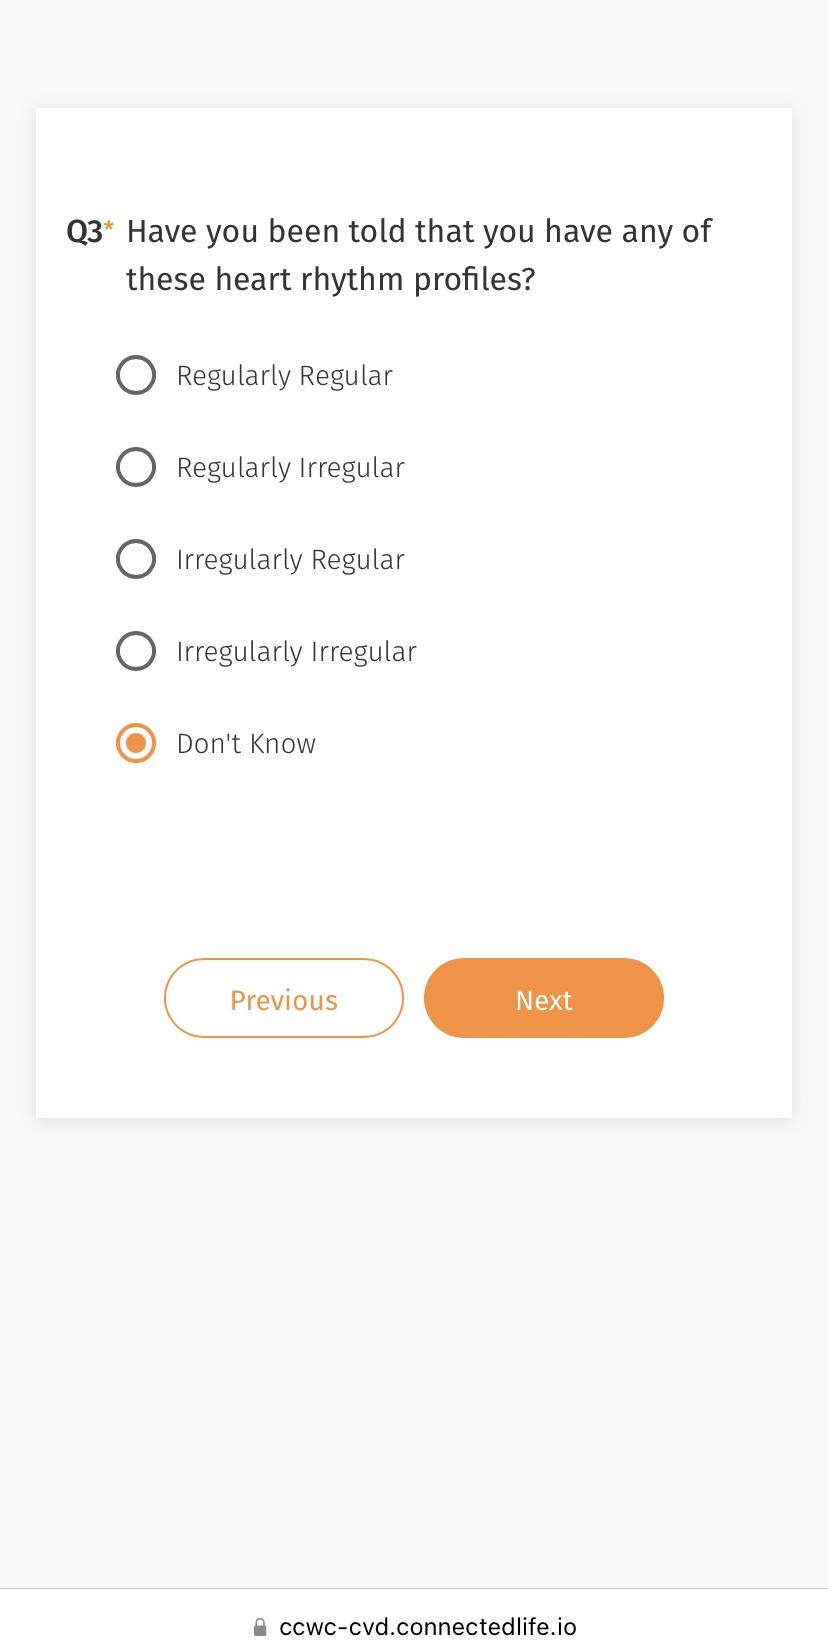
Q3. Have you been told that you have any of these heart rhythm profiles?

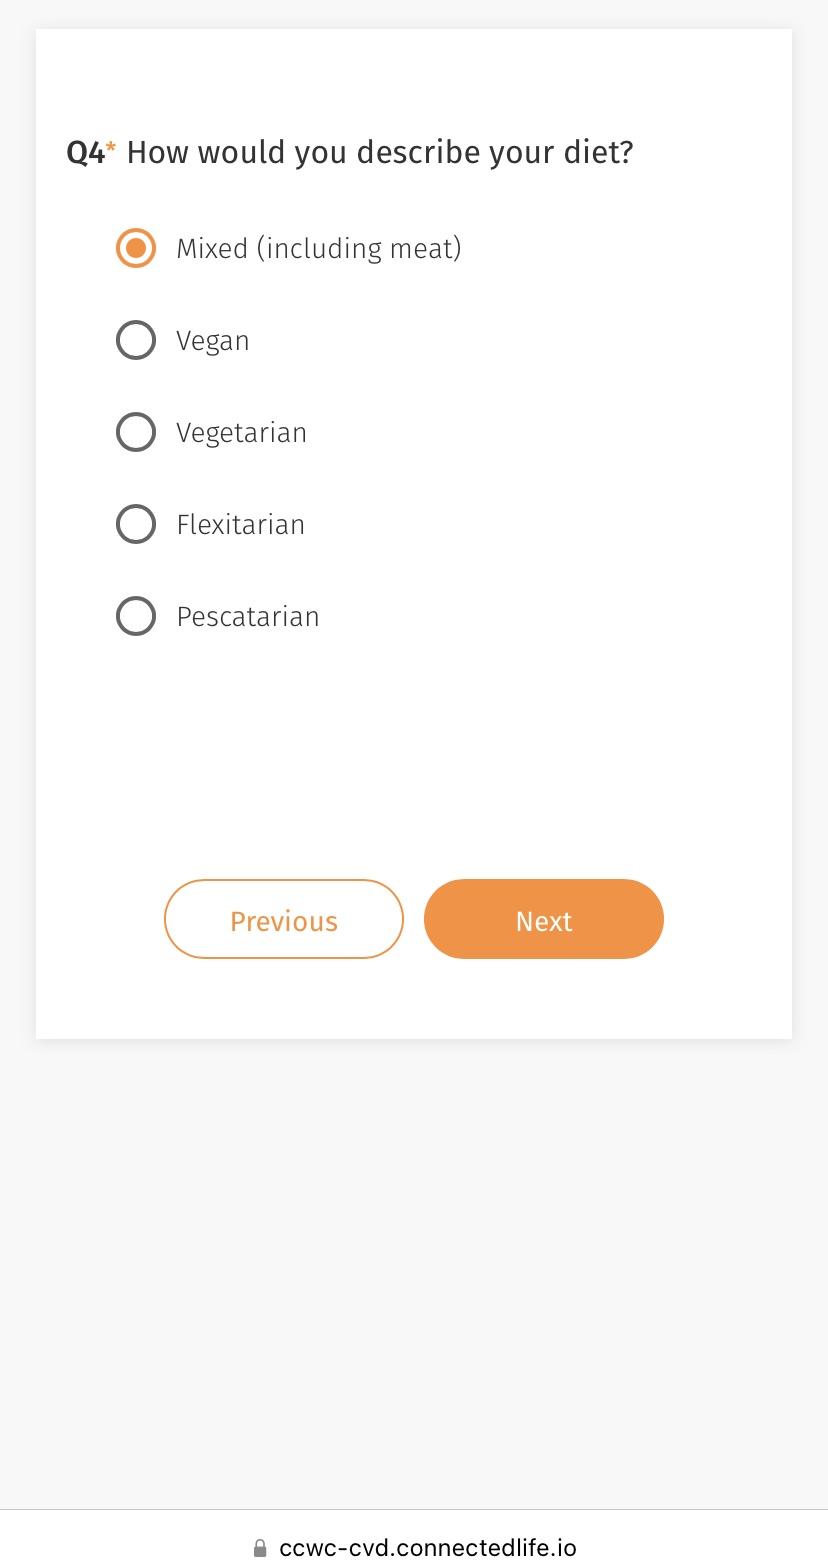
Q4. How would you describe your diet?

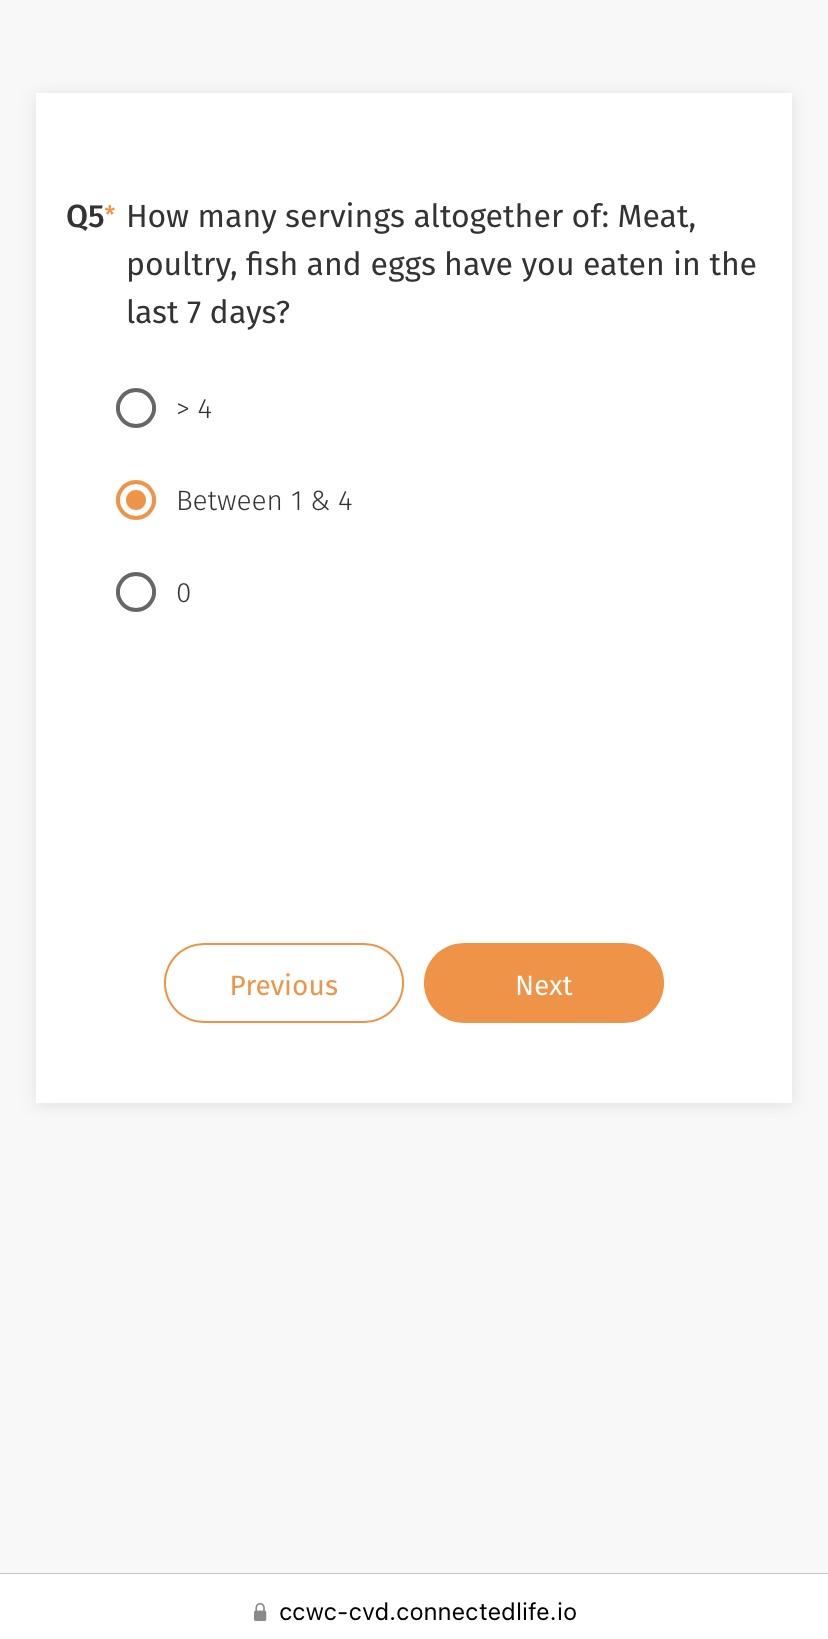
Q5. How many servings altogether of: Meat, poultry, fish and eggs have you eaten in the last 7 days?

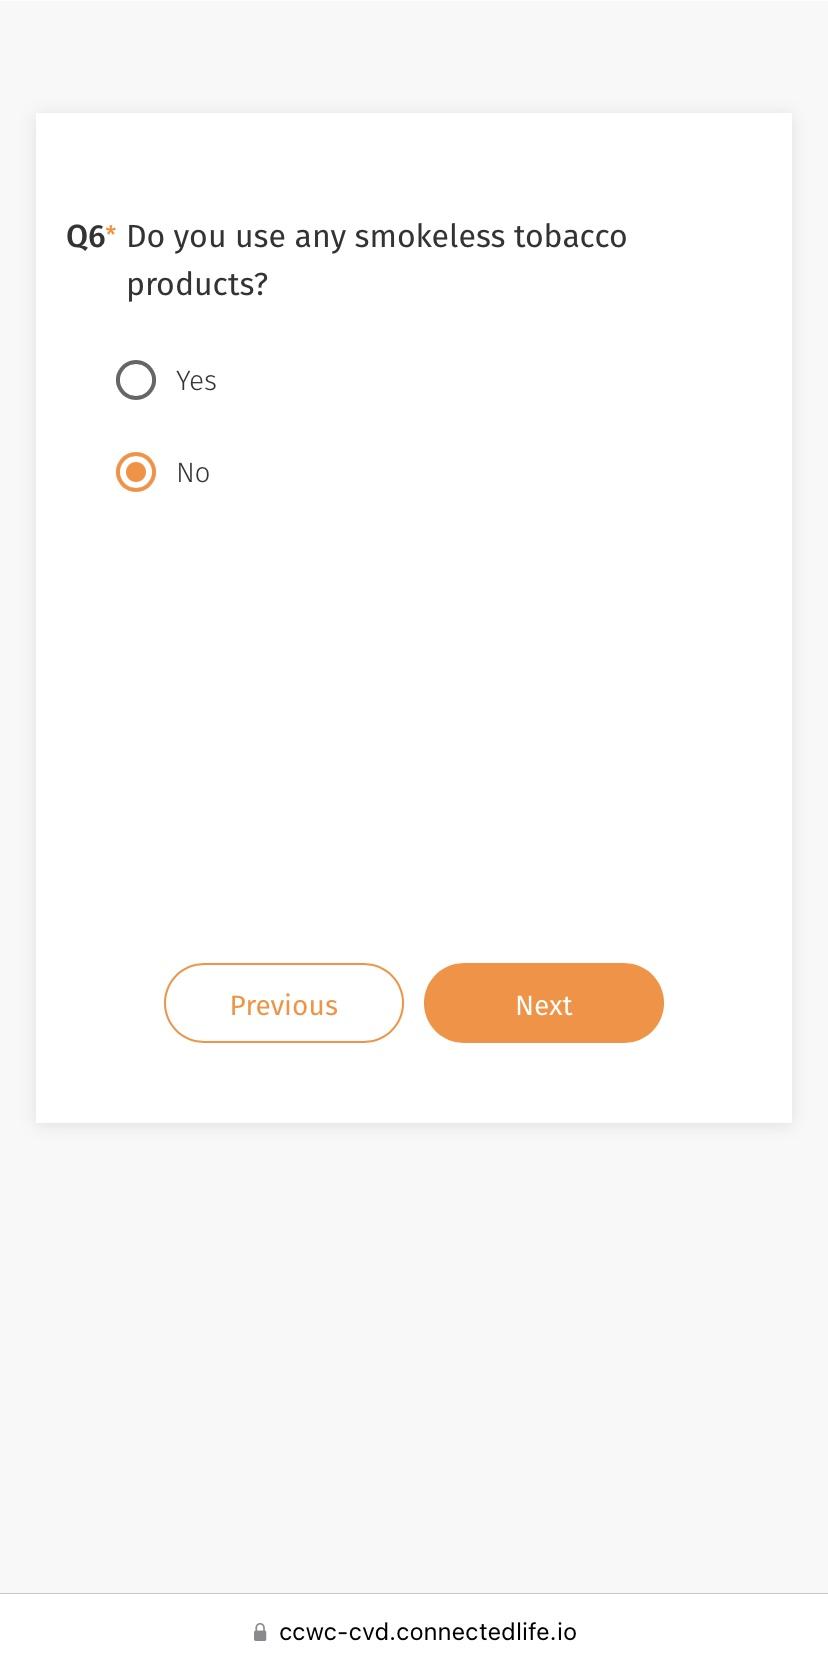
Q6. Do you use any smokeless tobacco products?

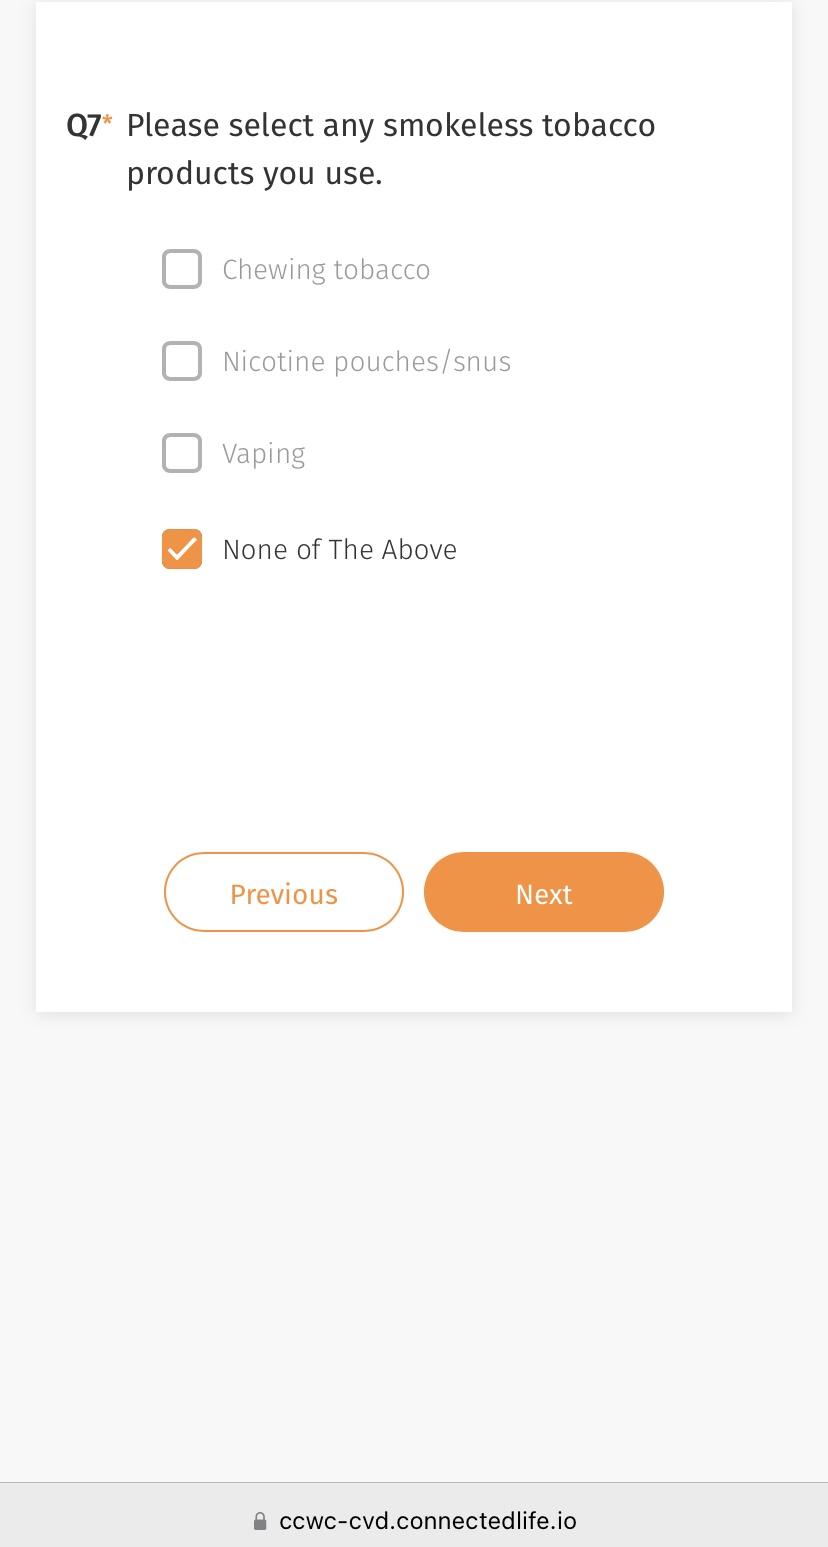
Q7. Please select any smokeless tobacco products you use.

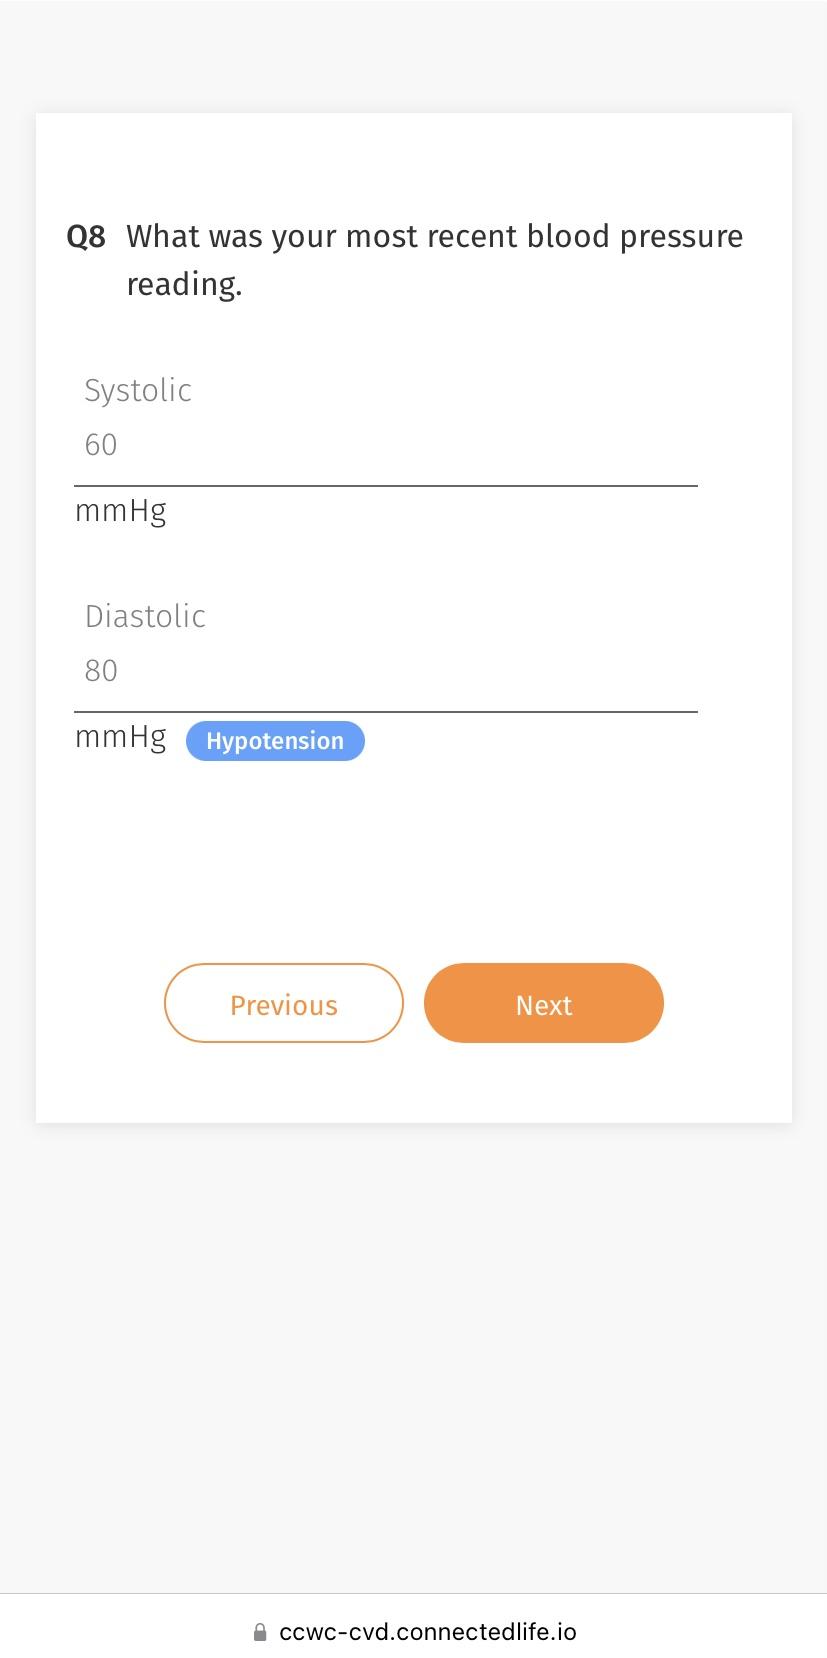
Q8. What was your most recent blood pressure reading?

Q9. Are you taking any medications for hypertension?

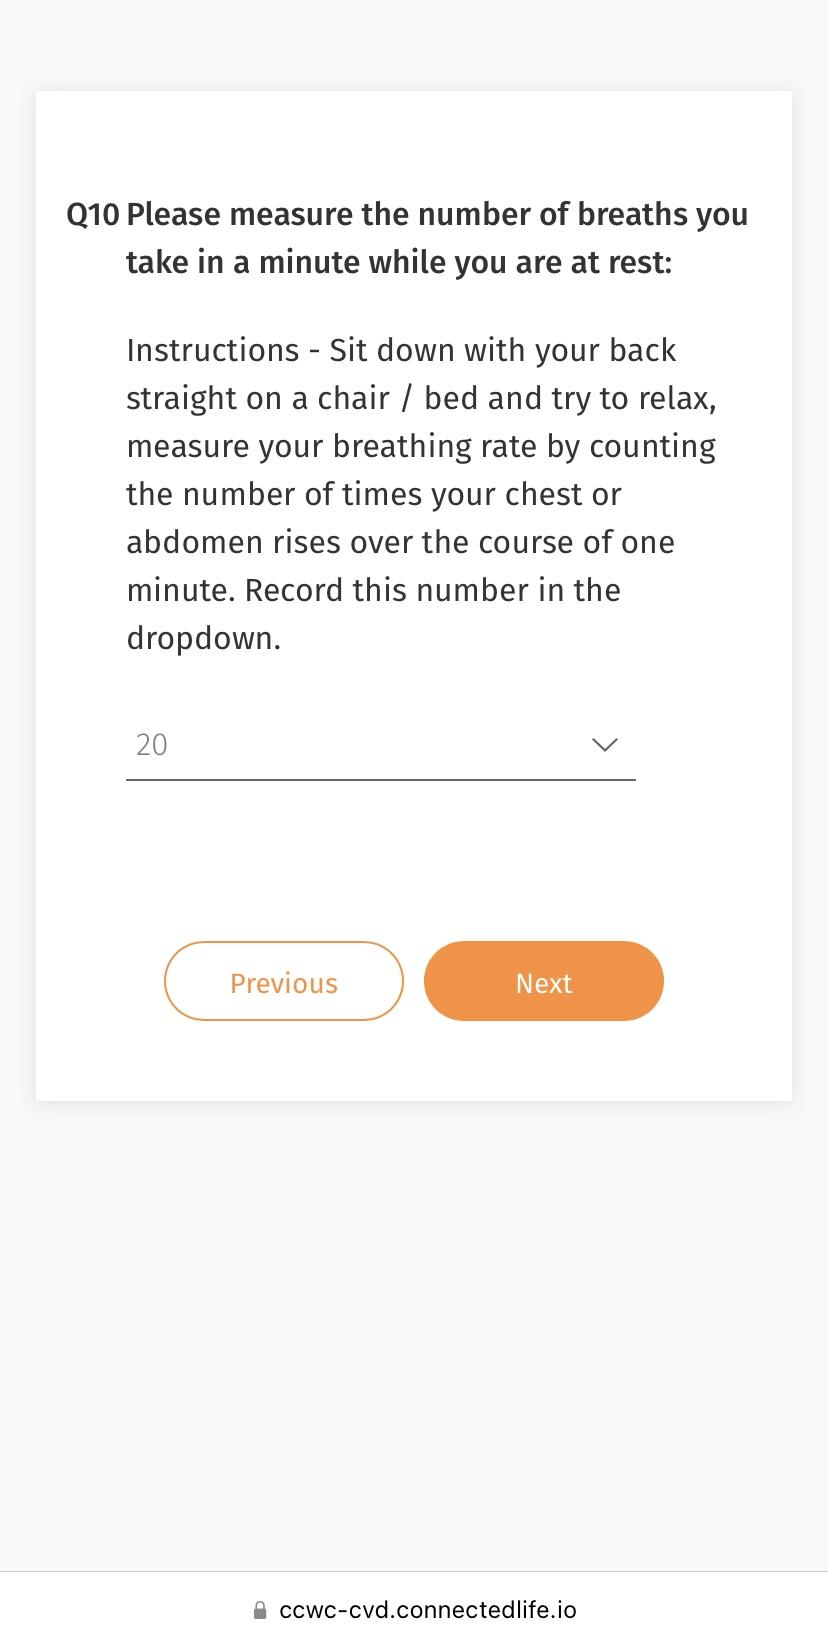
Q10. Please measure the number of breaths you take in a minute while you are at rest:

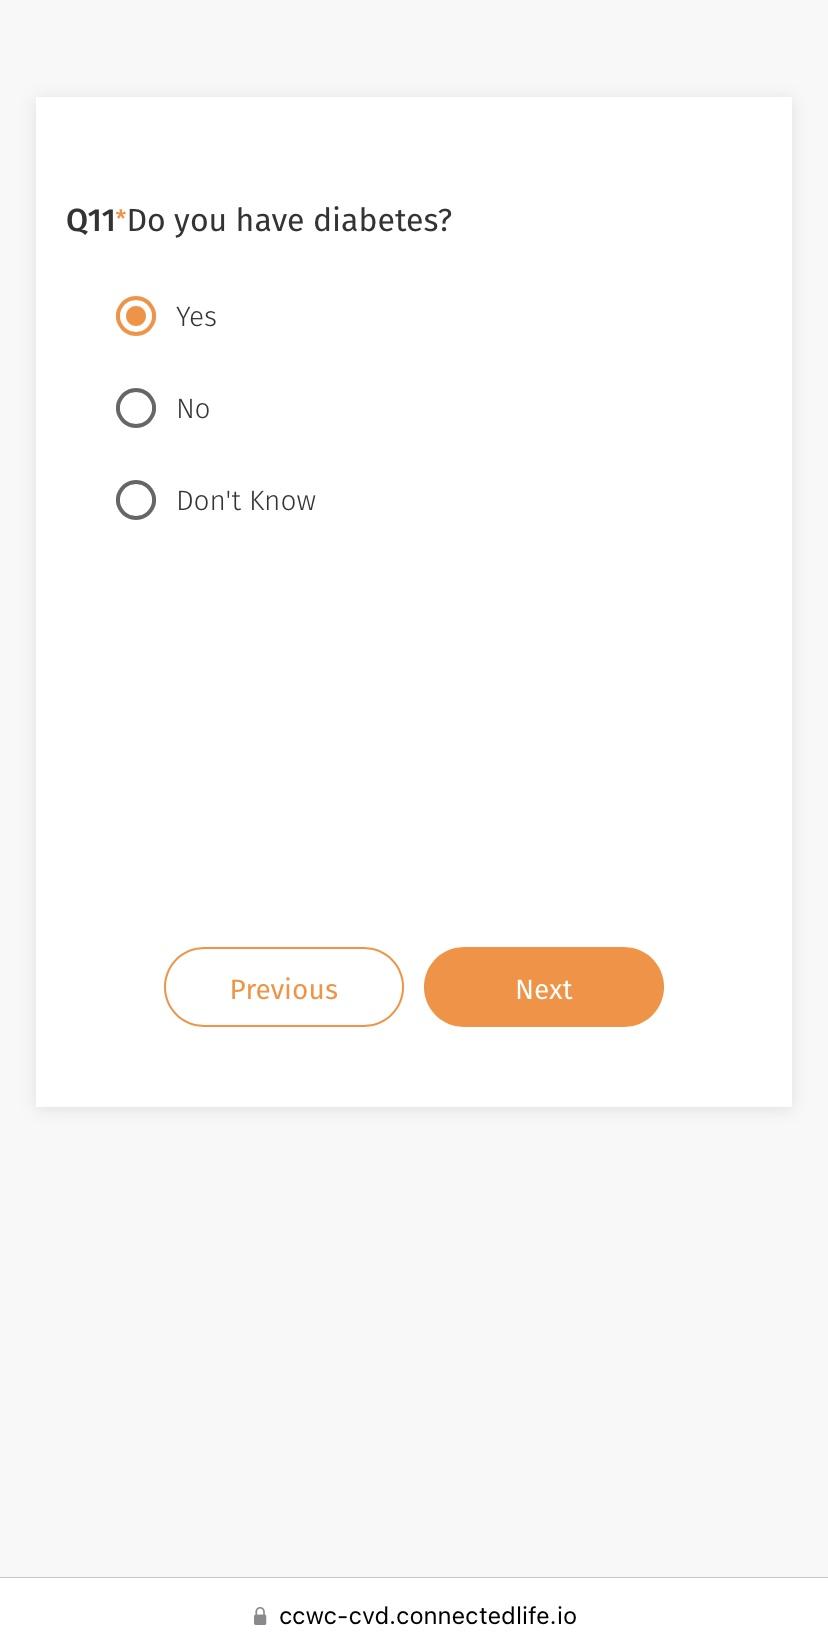
Q11. Do you have diabetes?

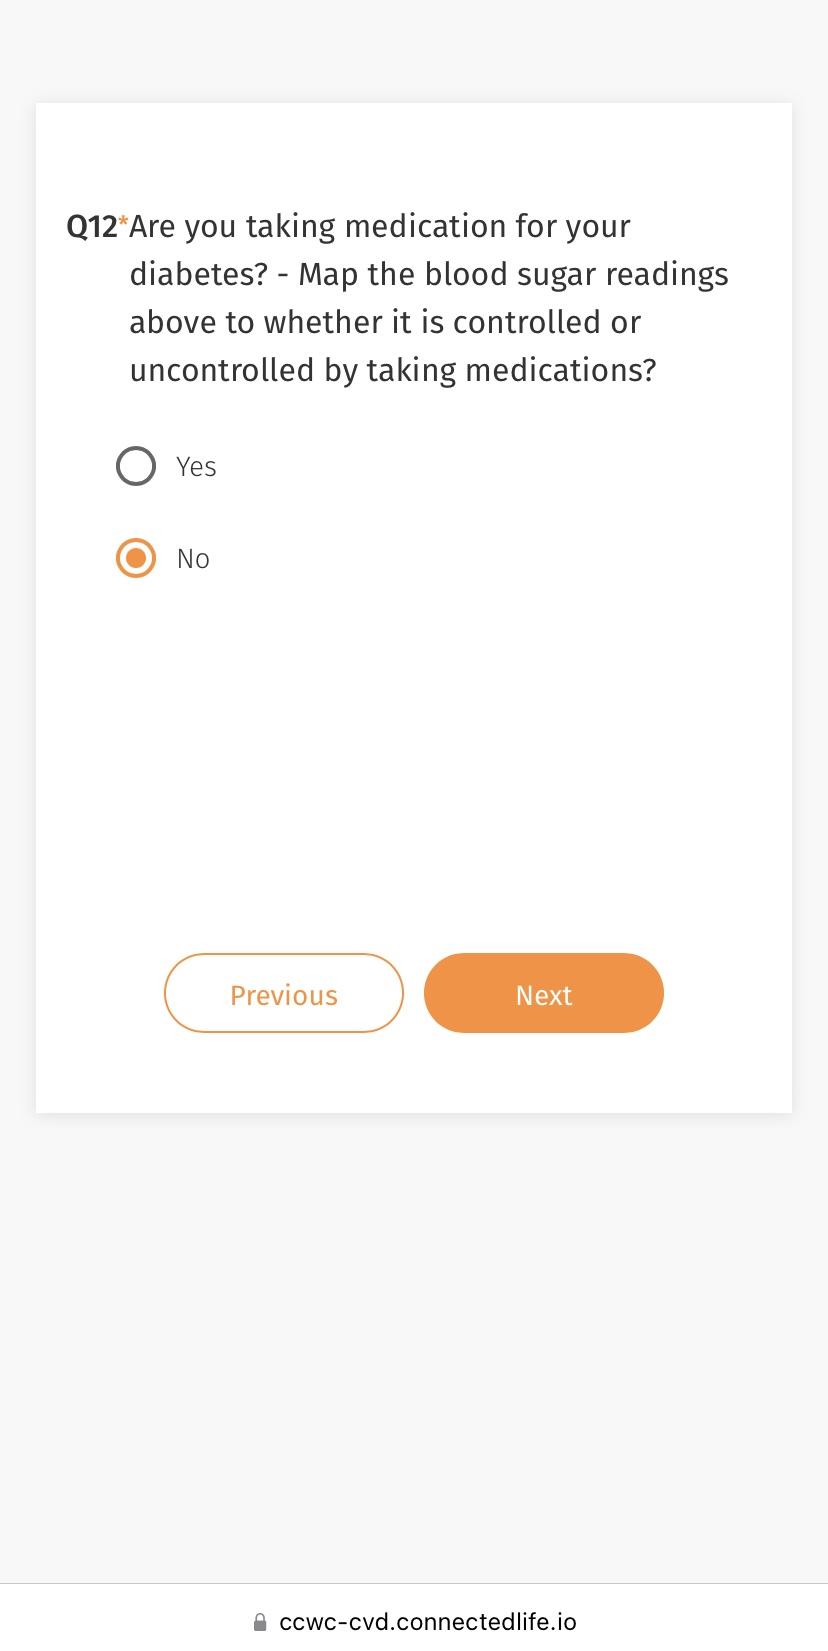
Q12. Are you taking medication for your diabetes? – Map the blood sugar readings above to whether it is controlled or uncontrolled by taking medications.

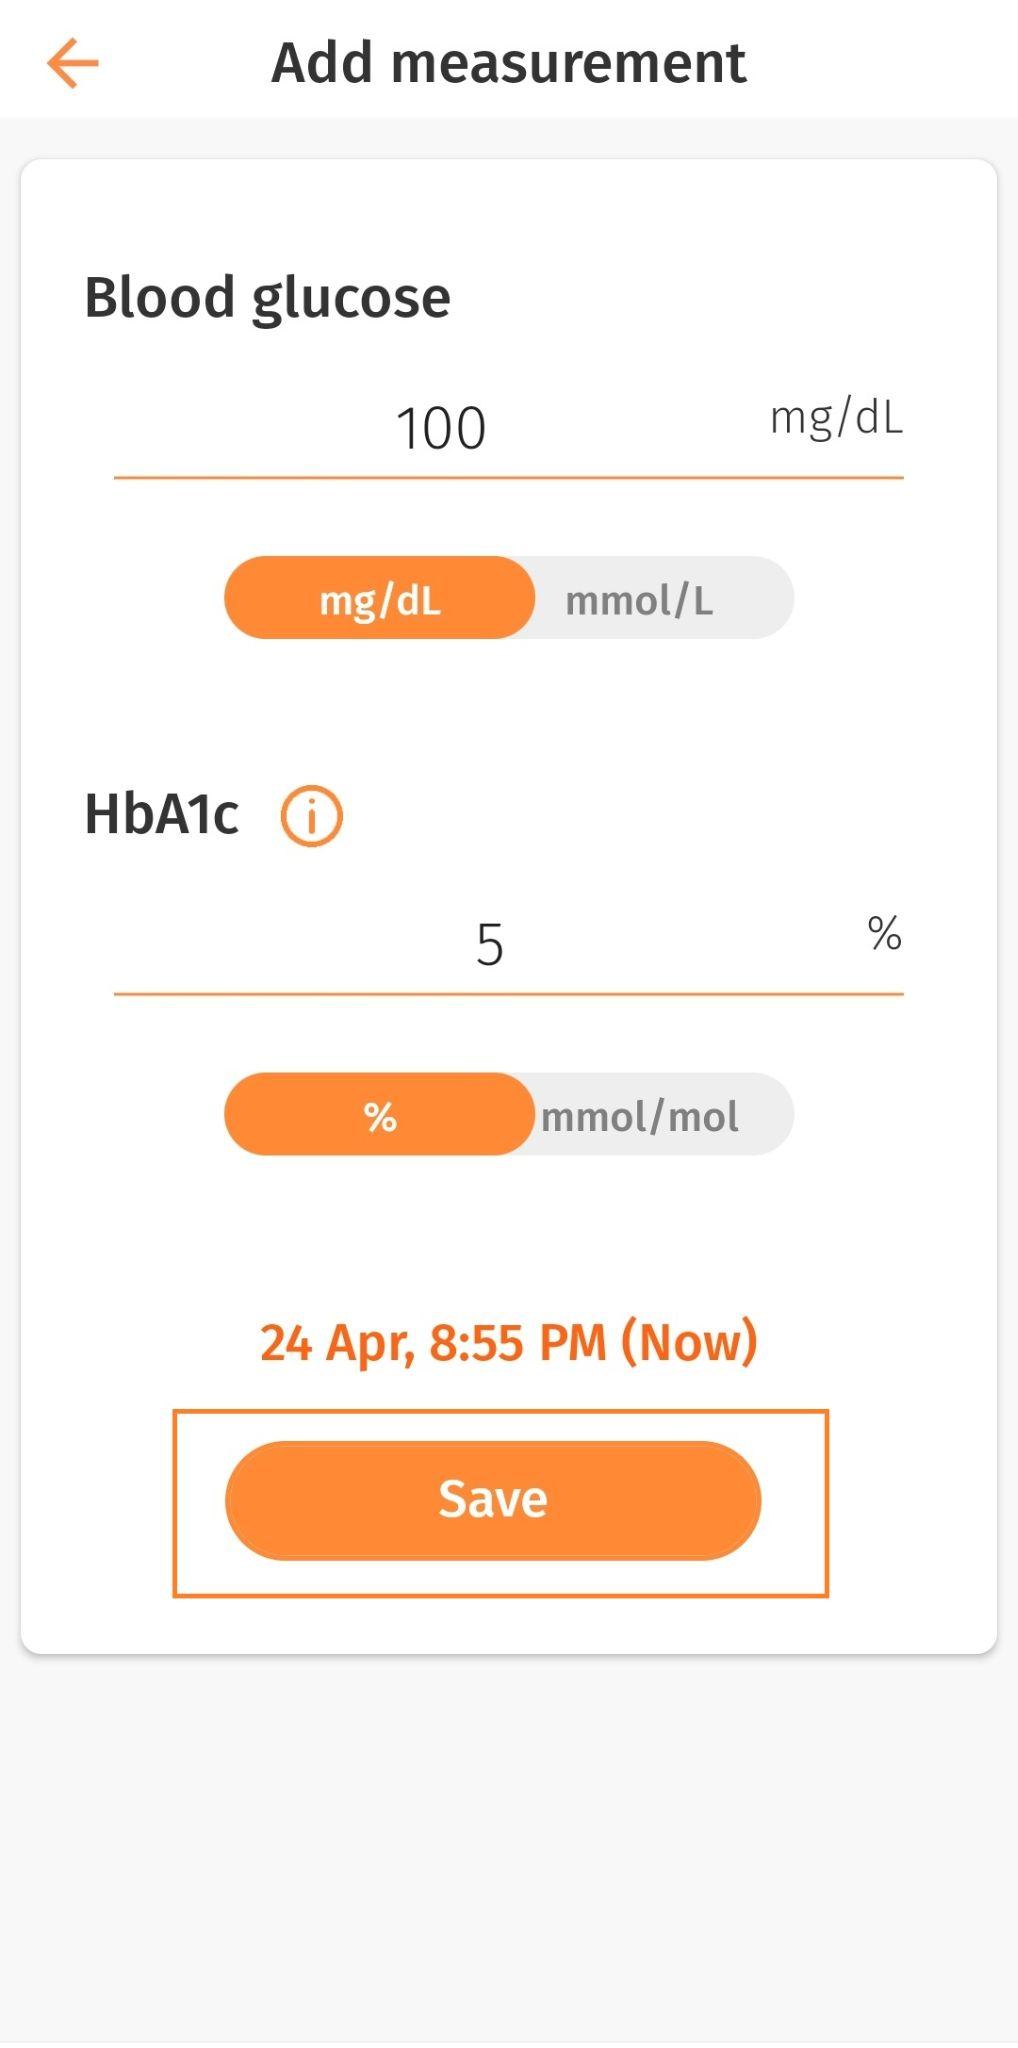
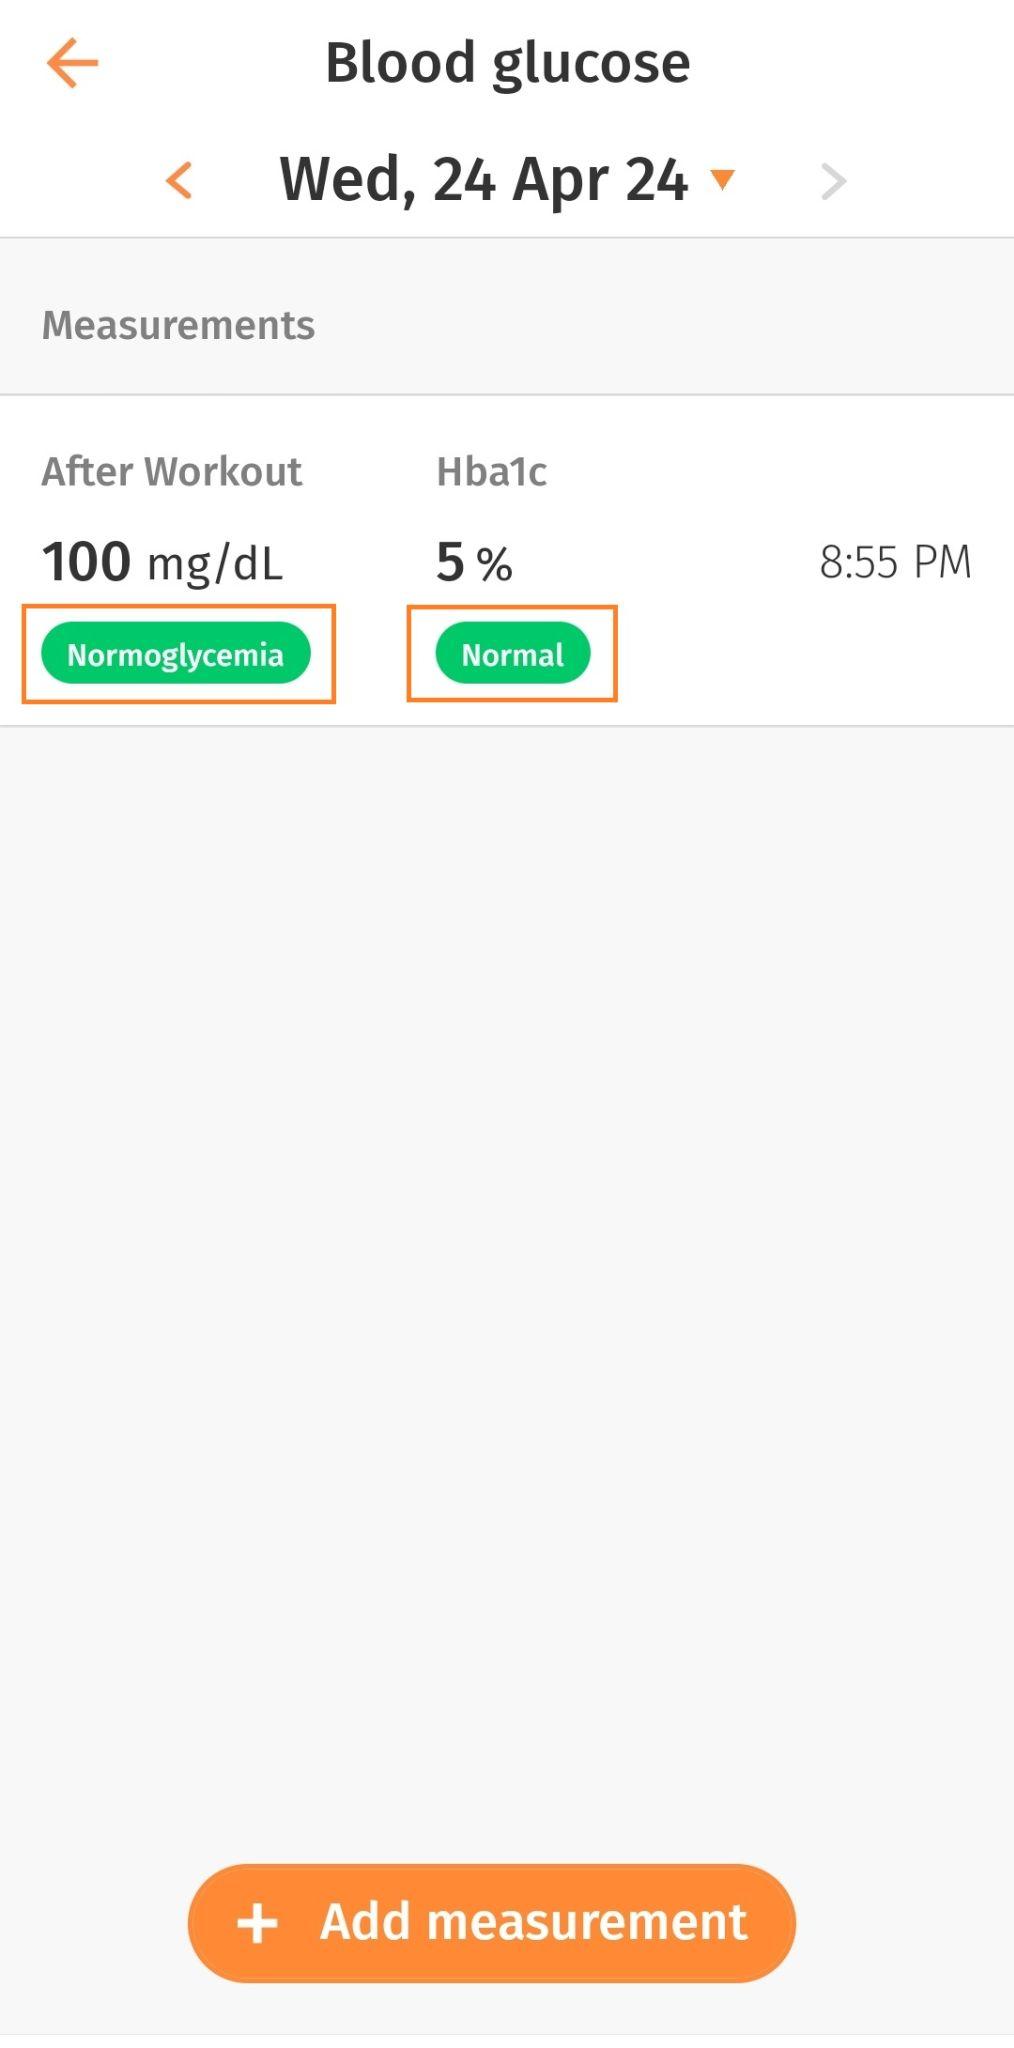
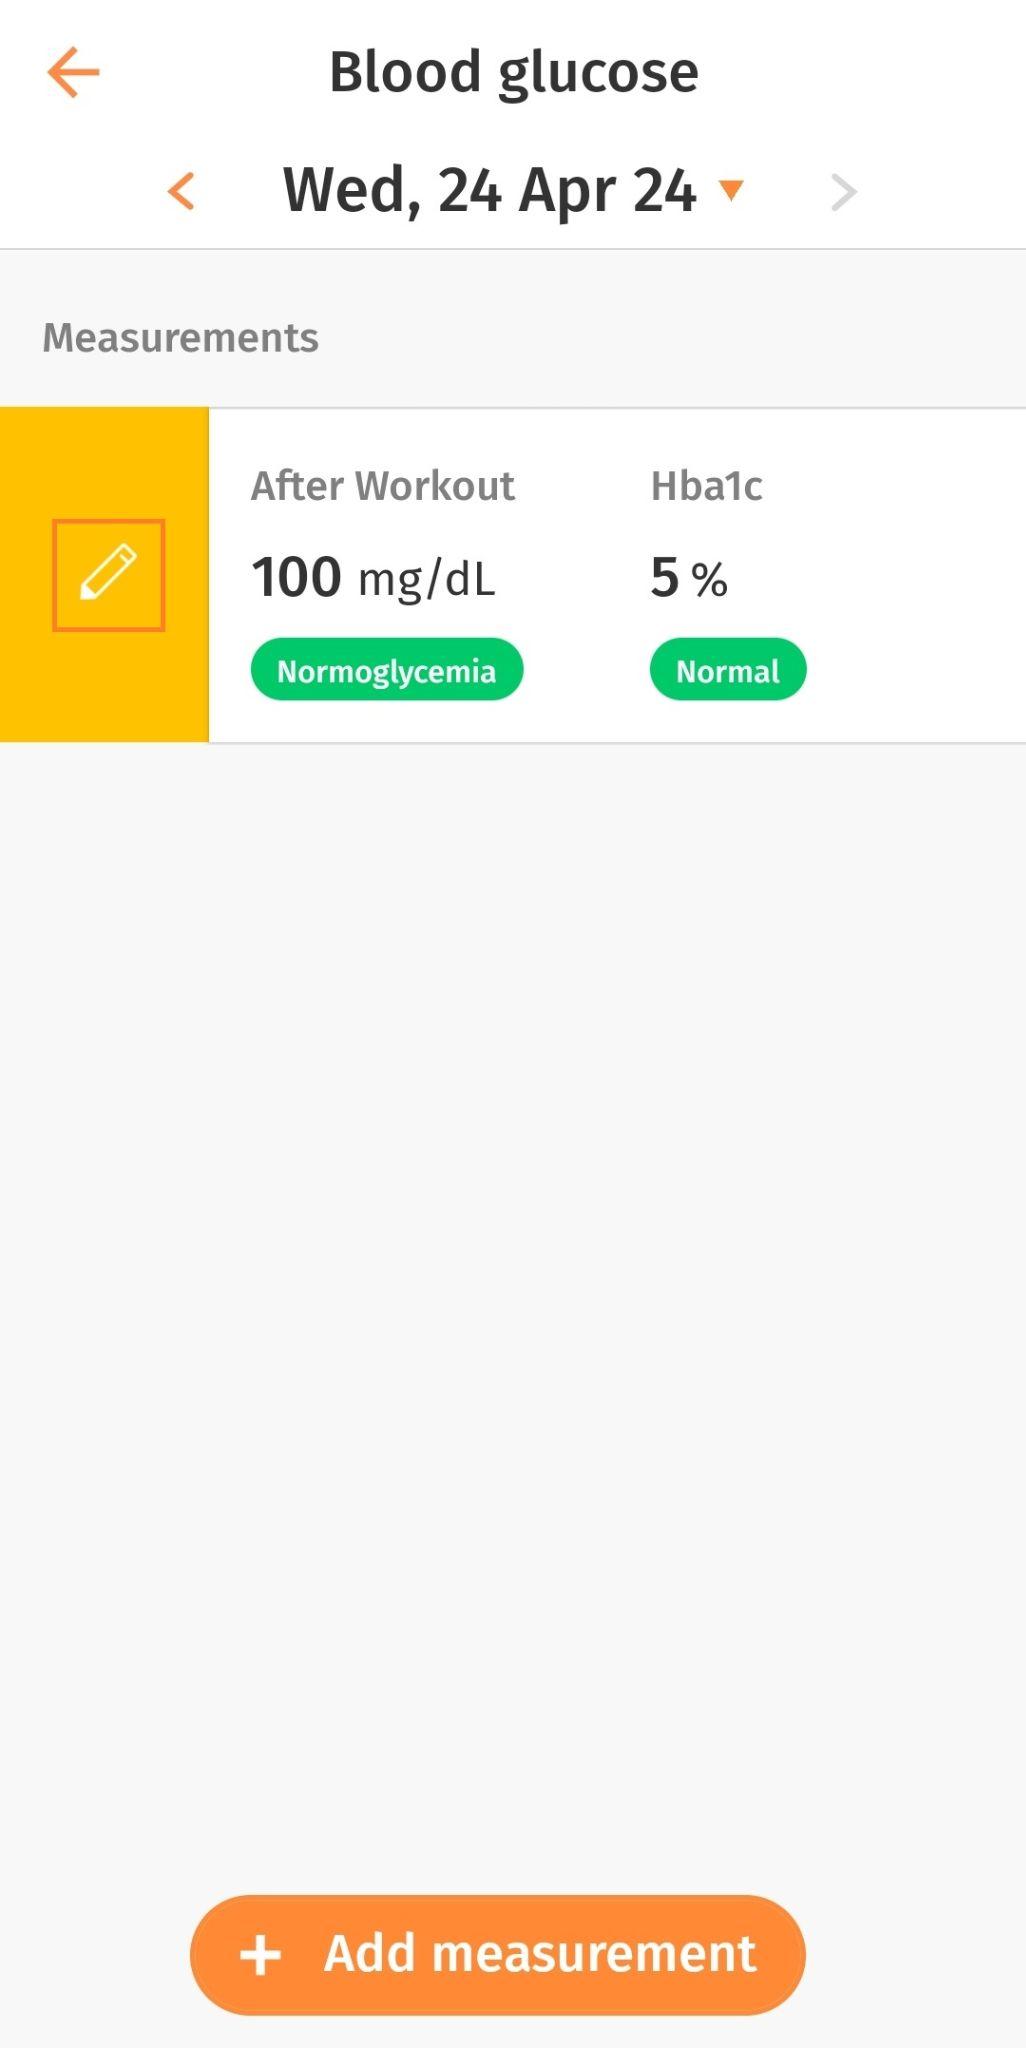
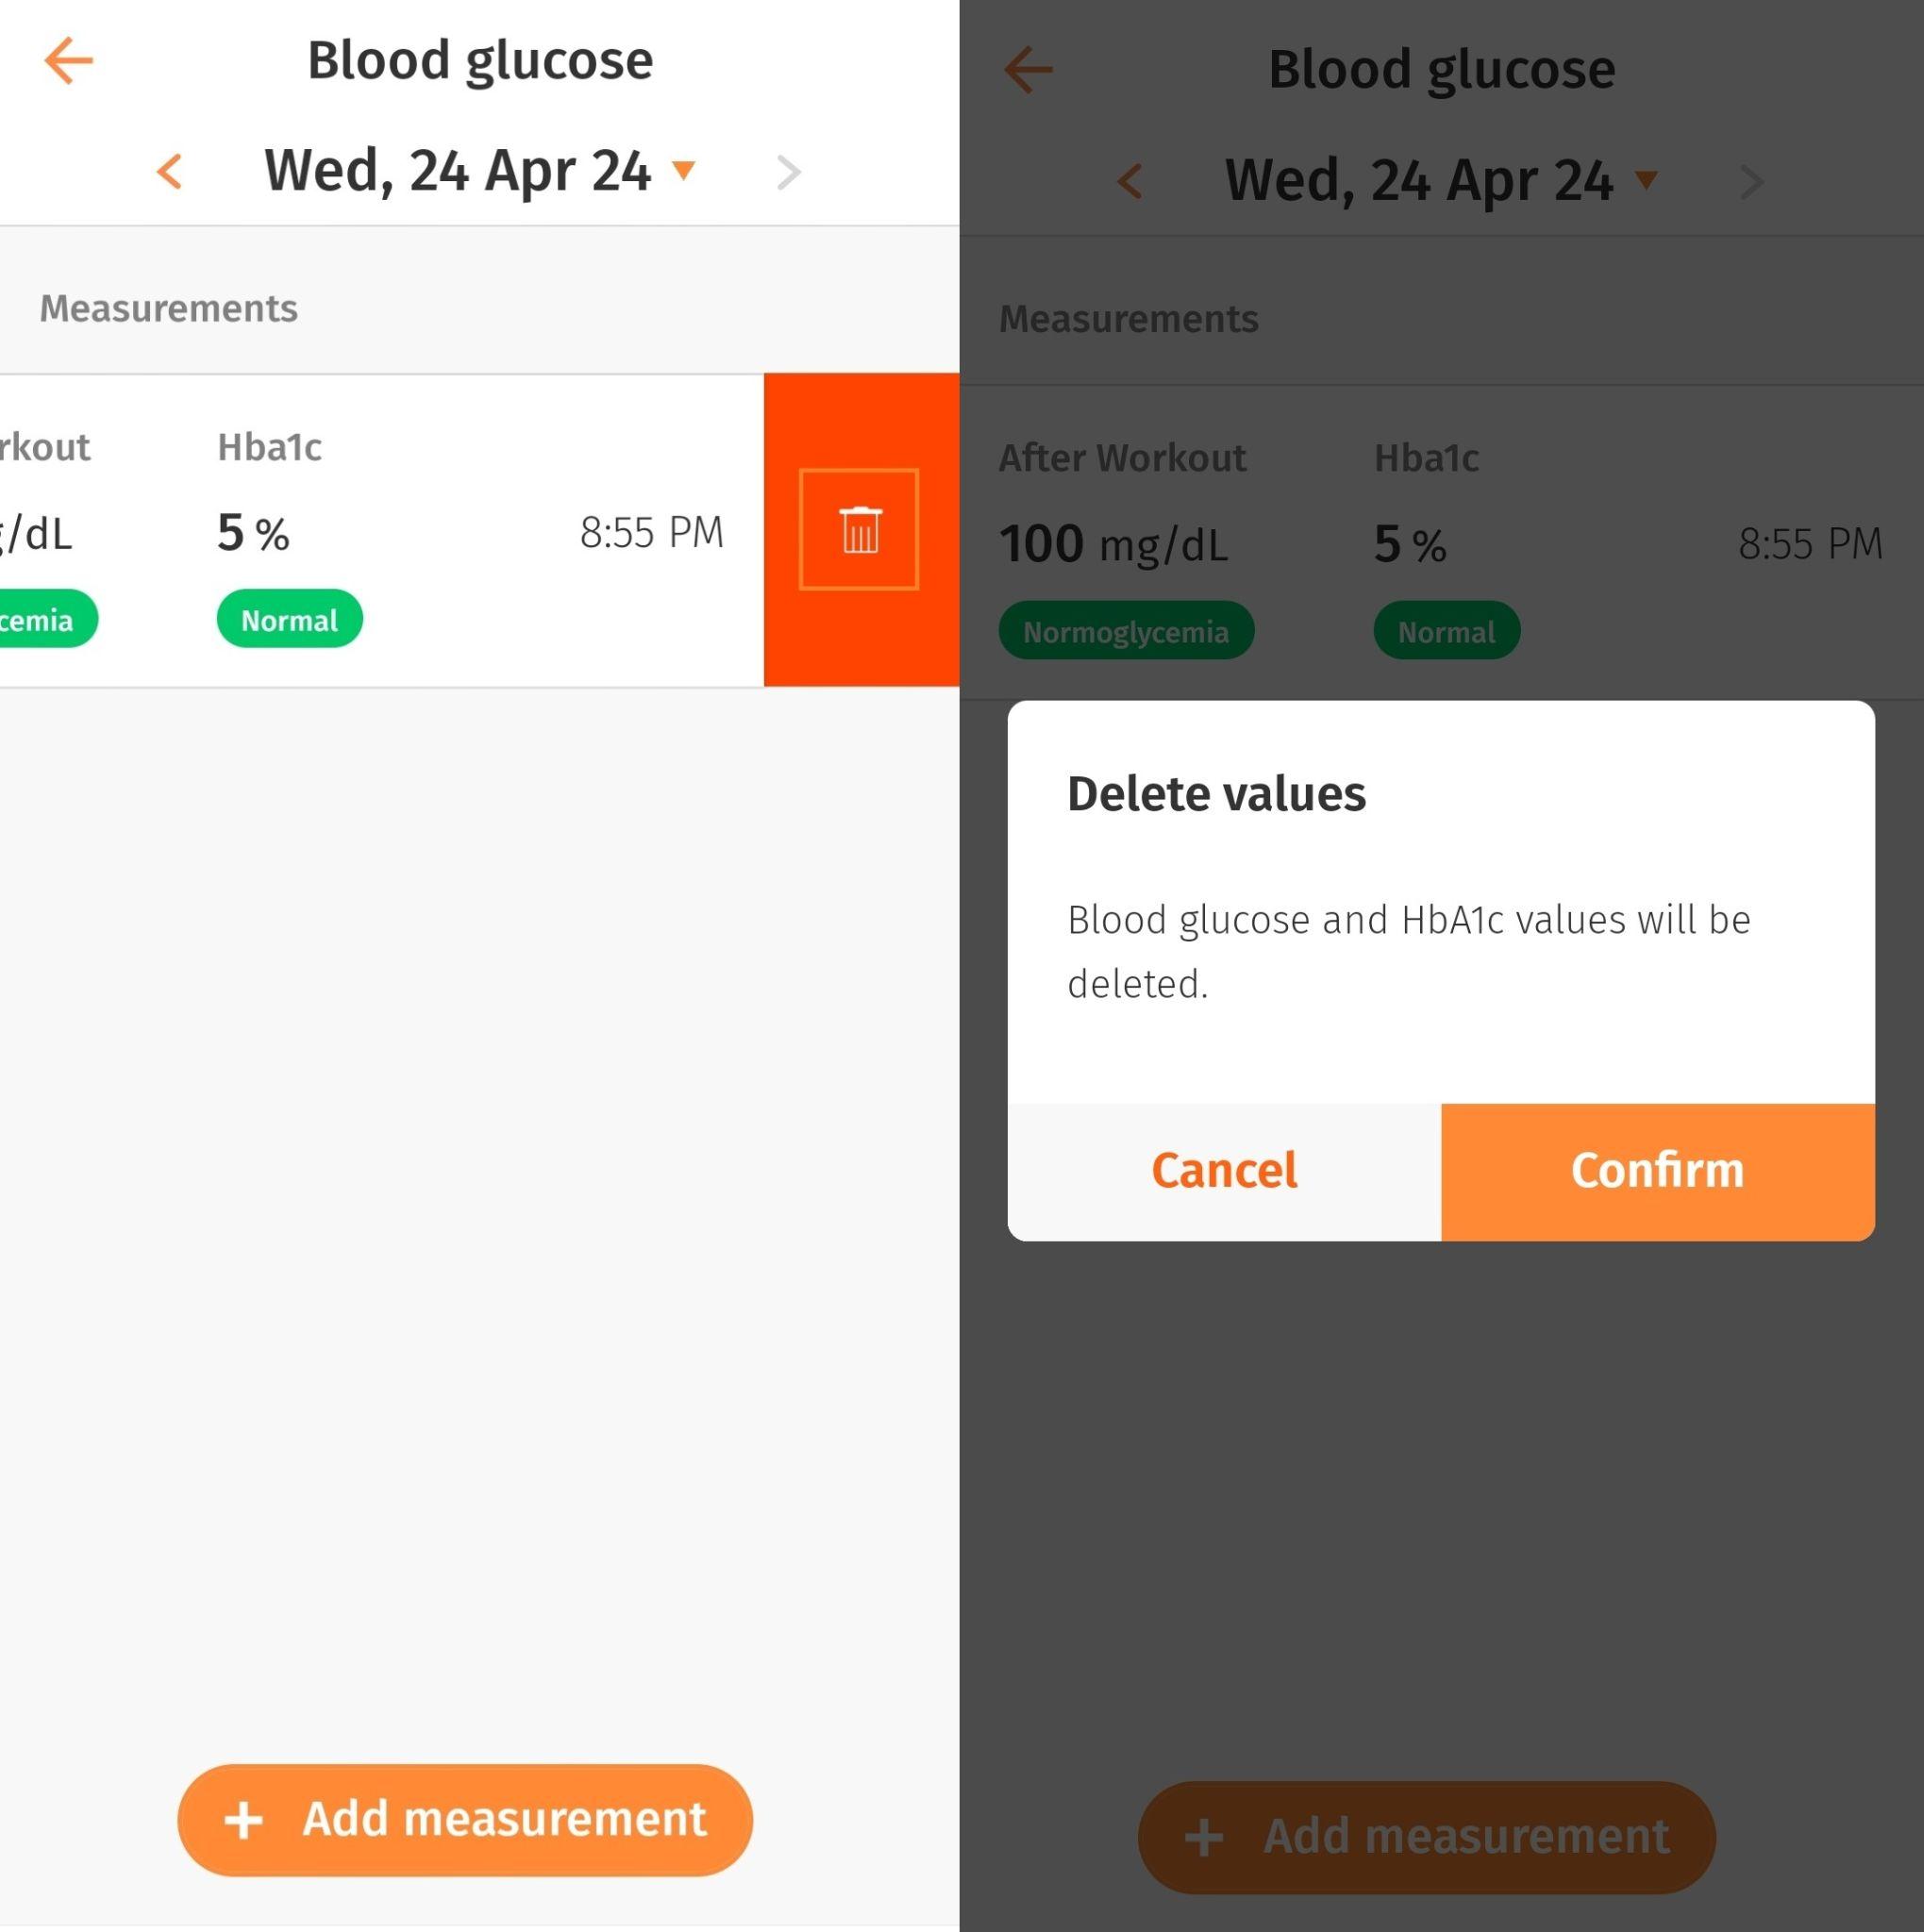
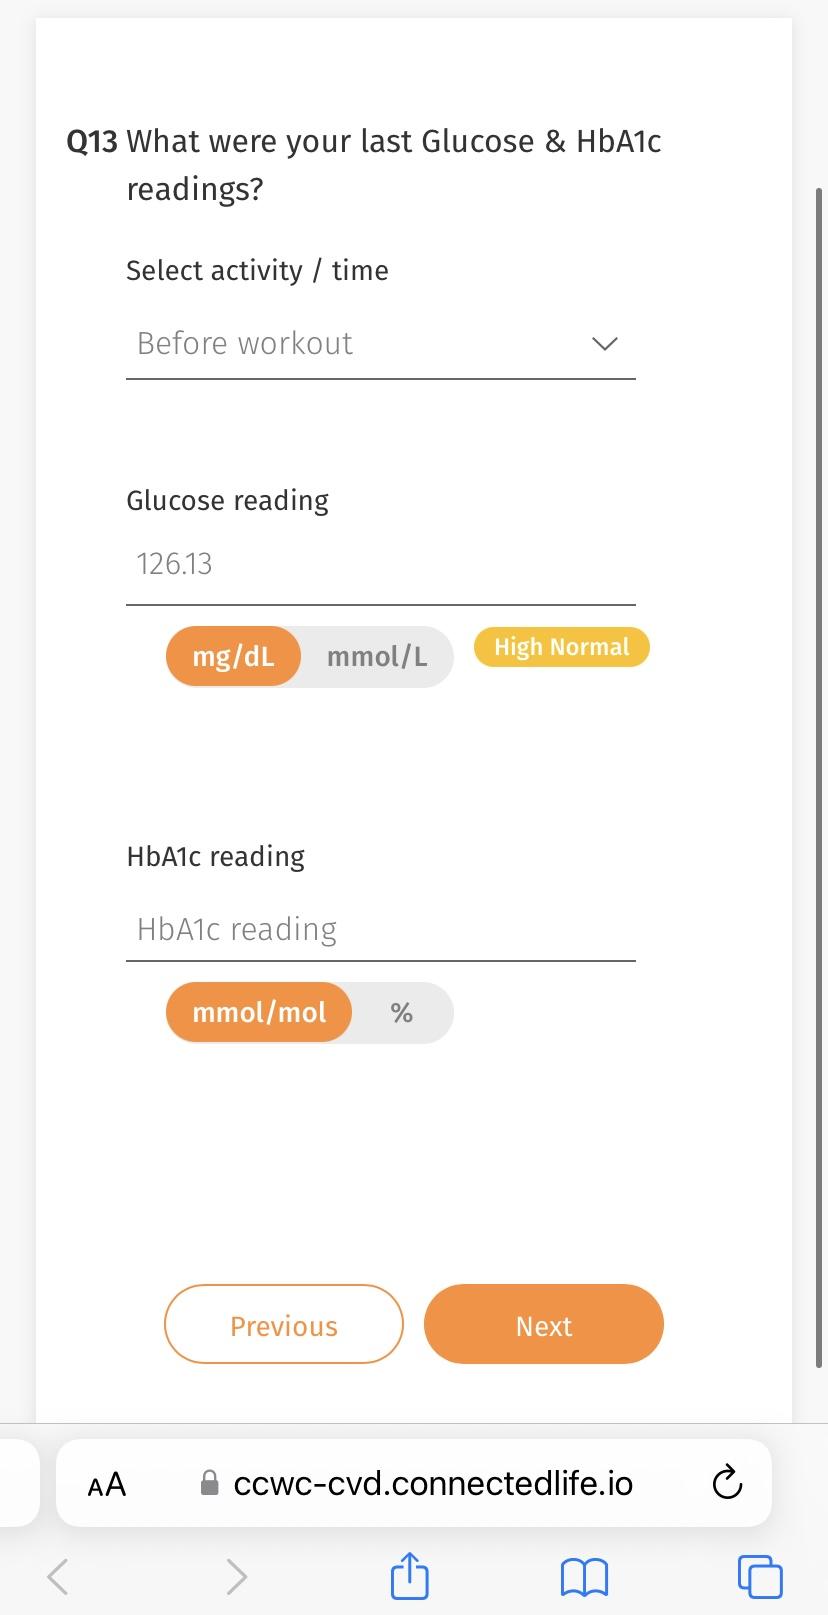
Q13. What were your last Glucose & HbA1c readings?

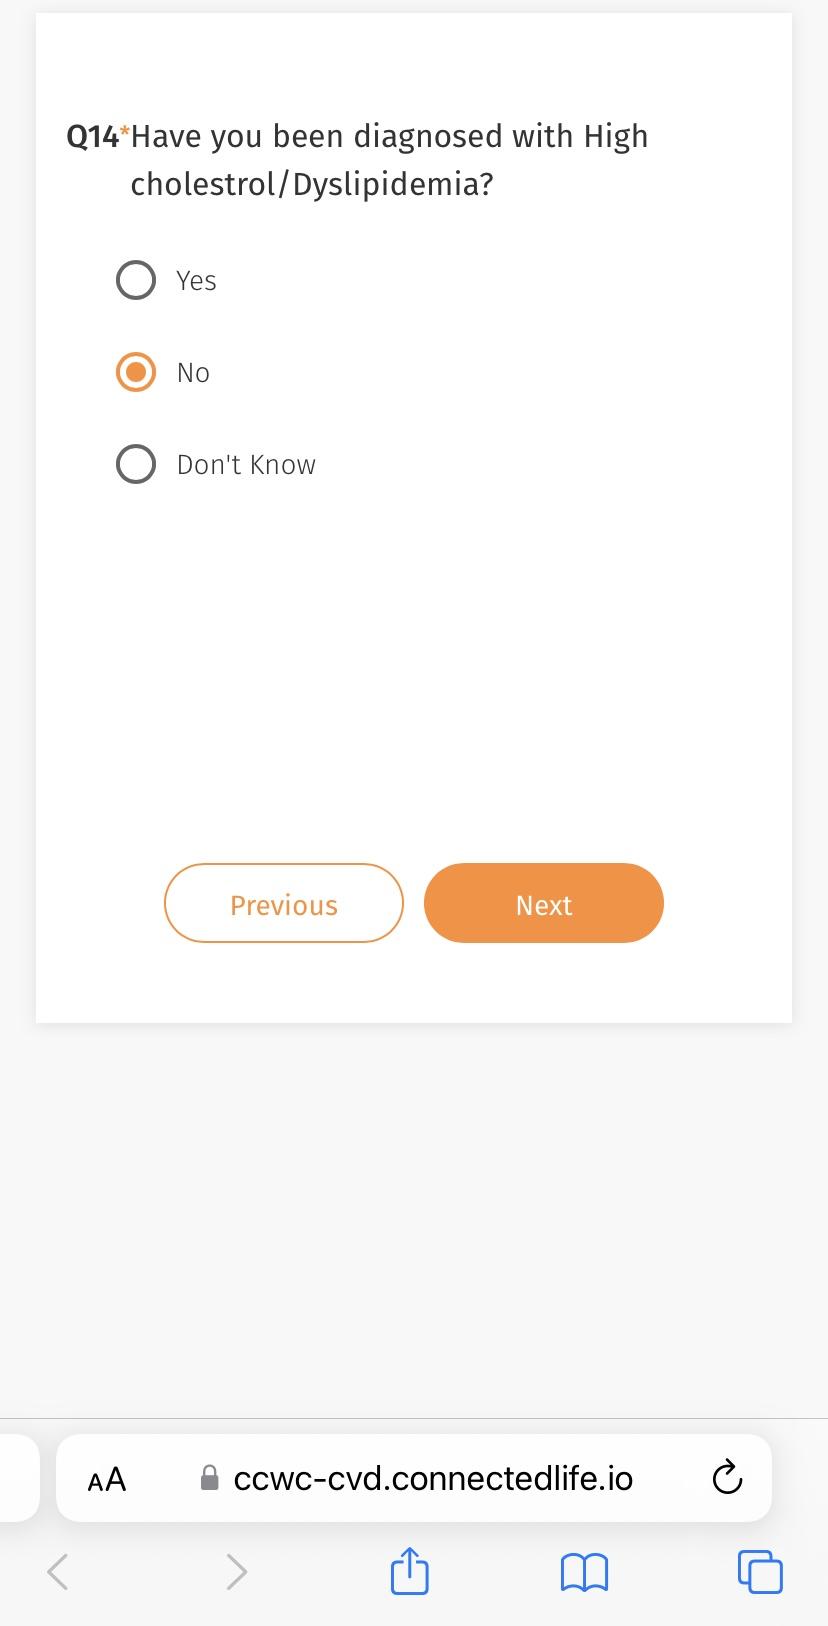
Q14. Have you been diagnosed with High cholesterol/Dyslipidemia?

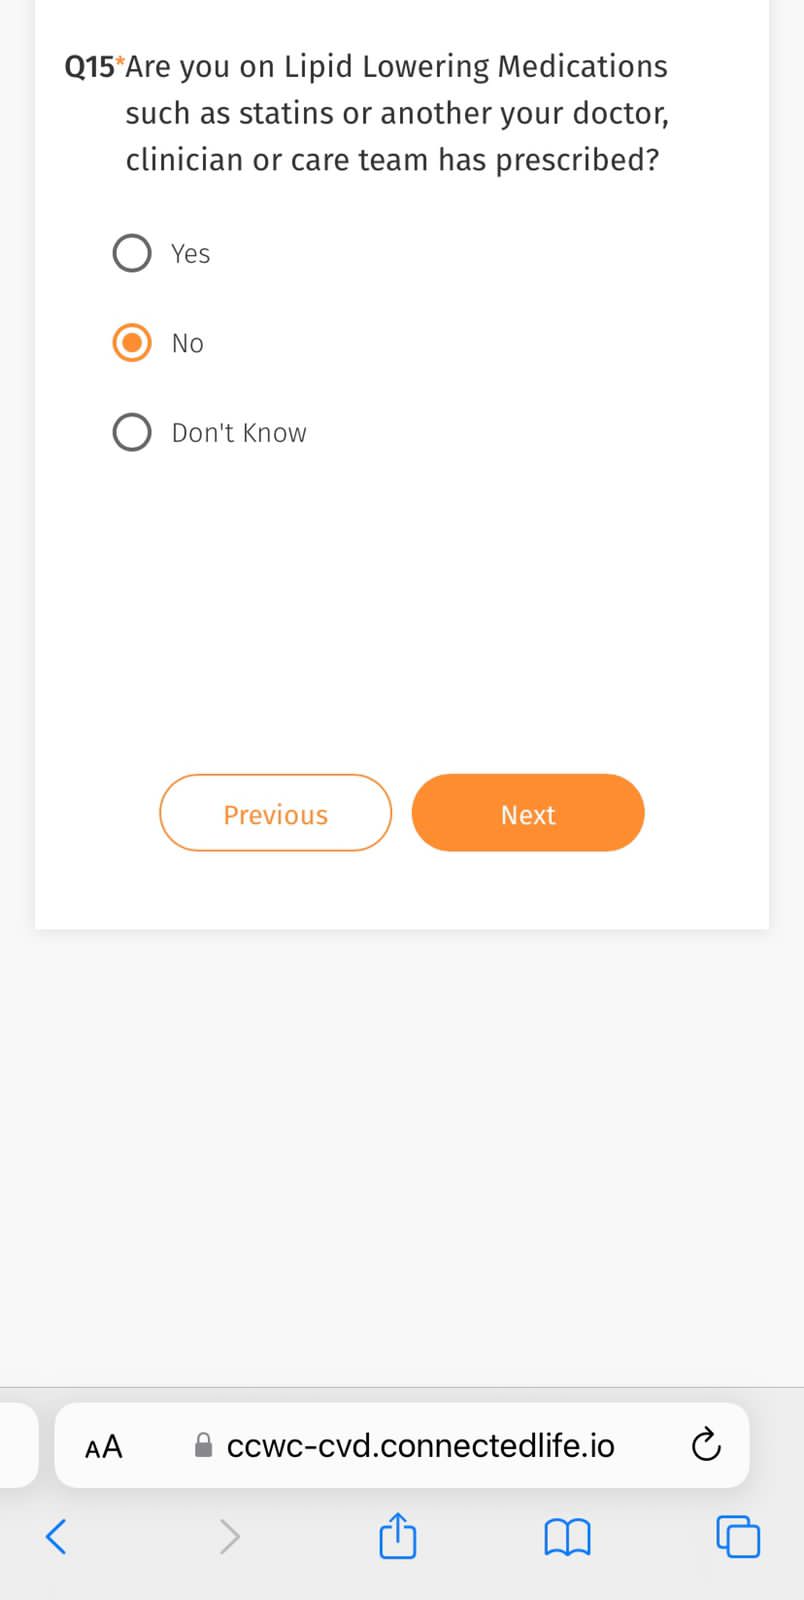
Q15. Are you on lipid-lowering medications such as statins or another your doctor, clinician or care team has prescribed?

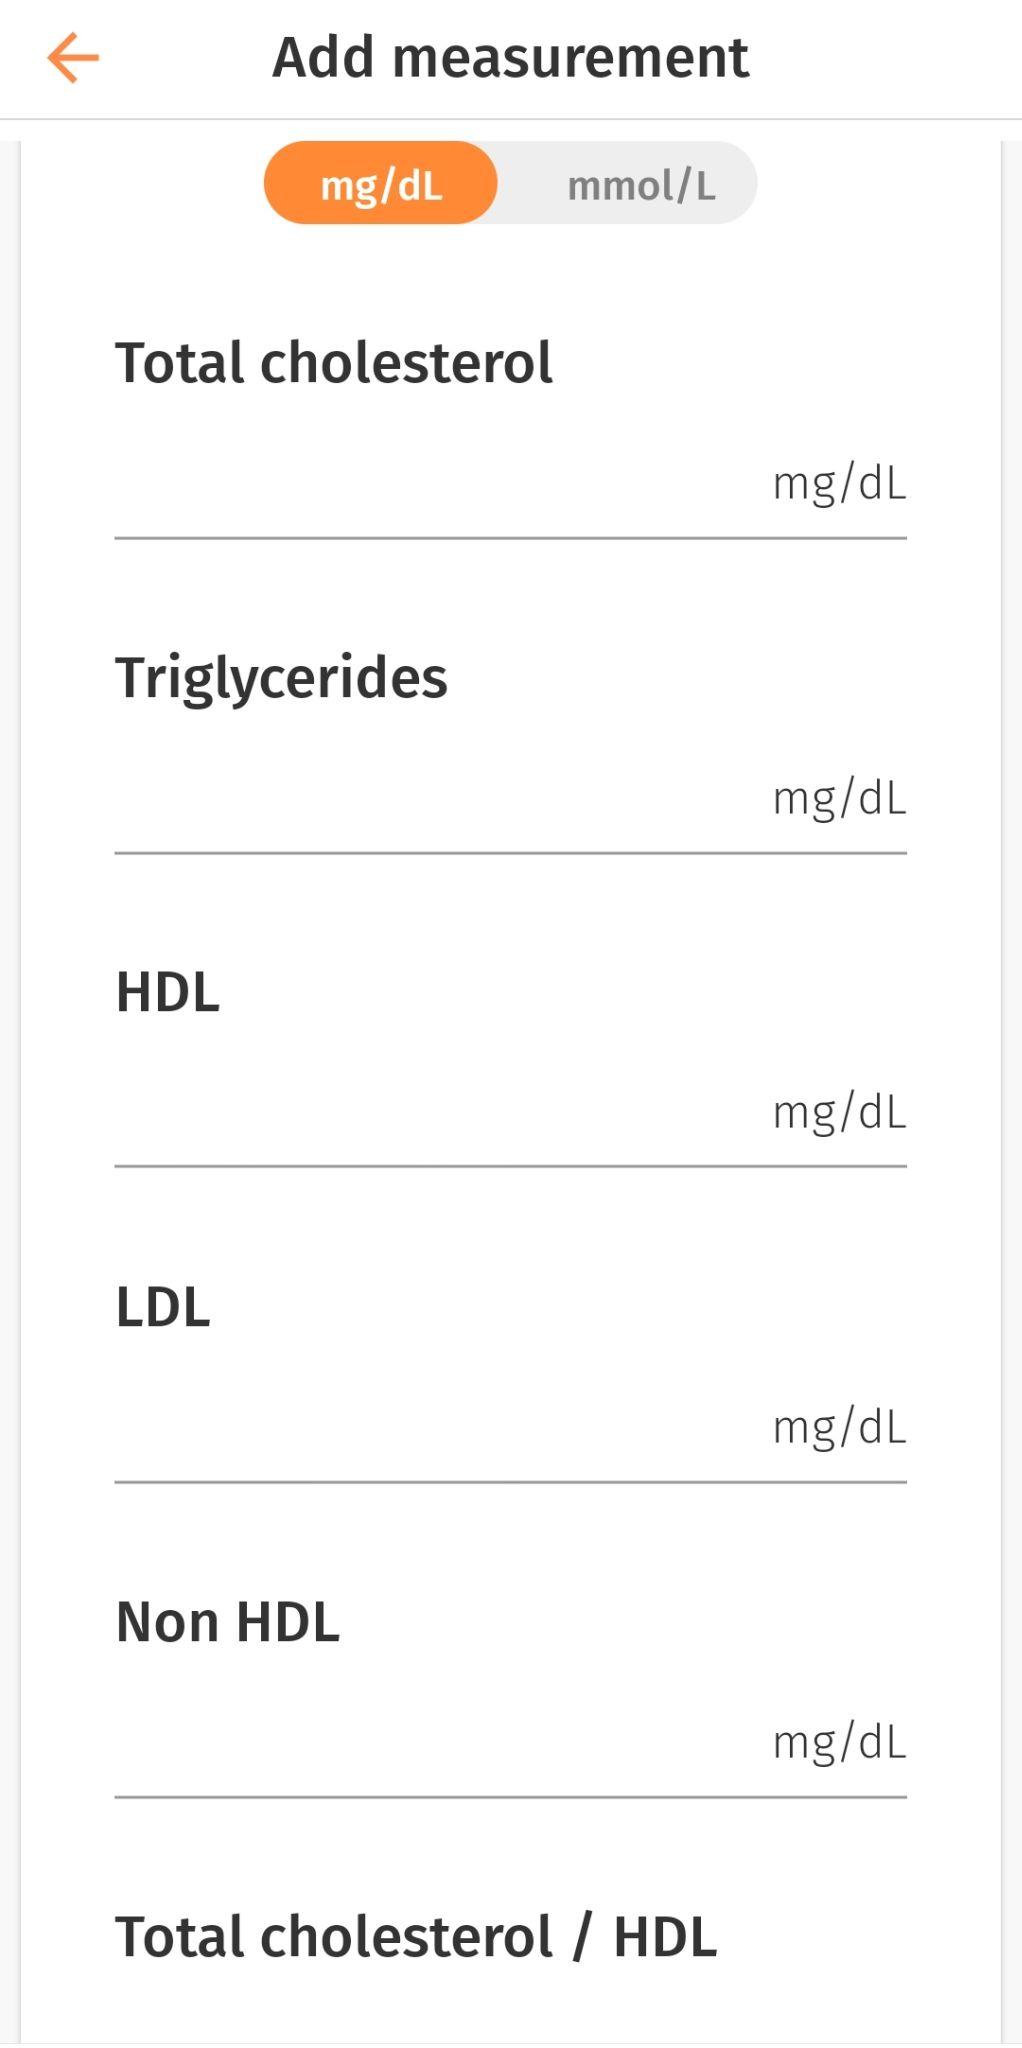
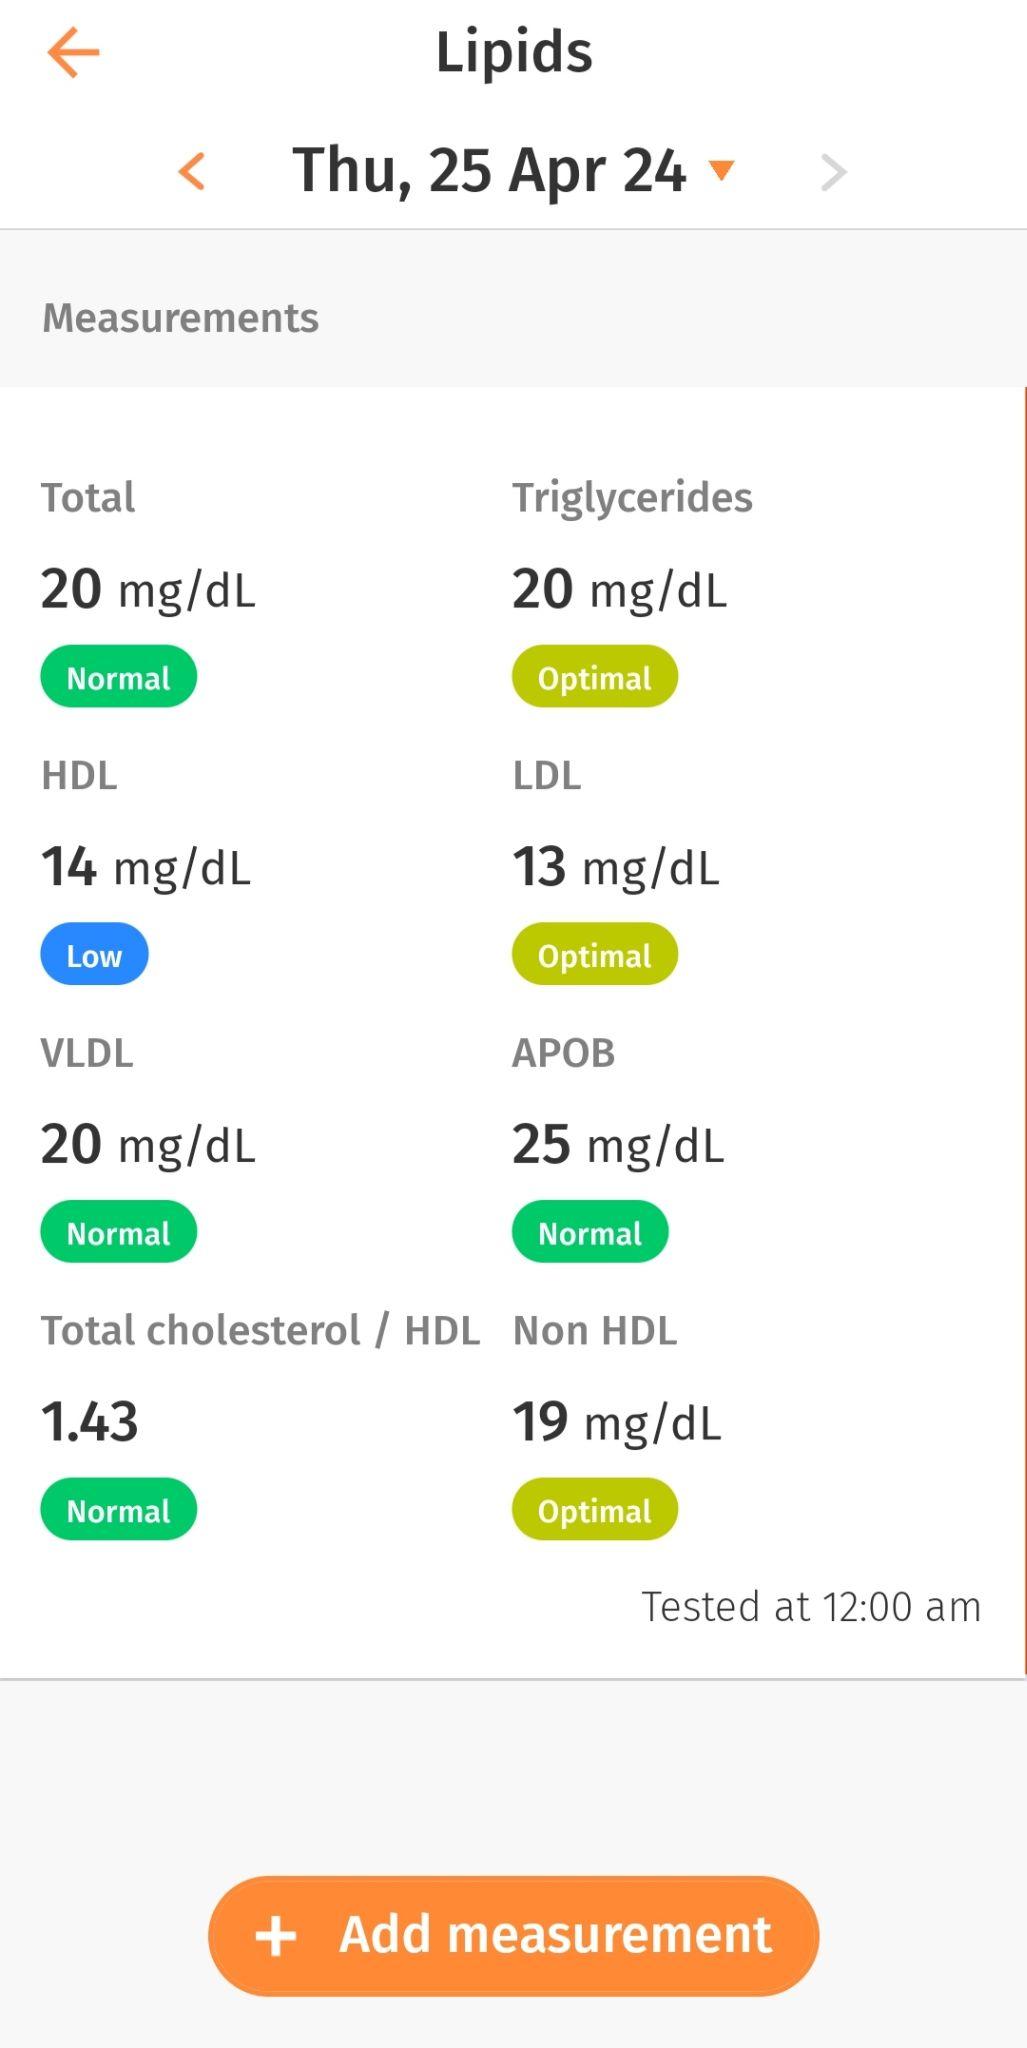
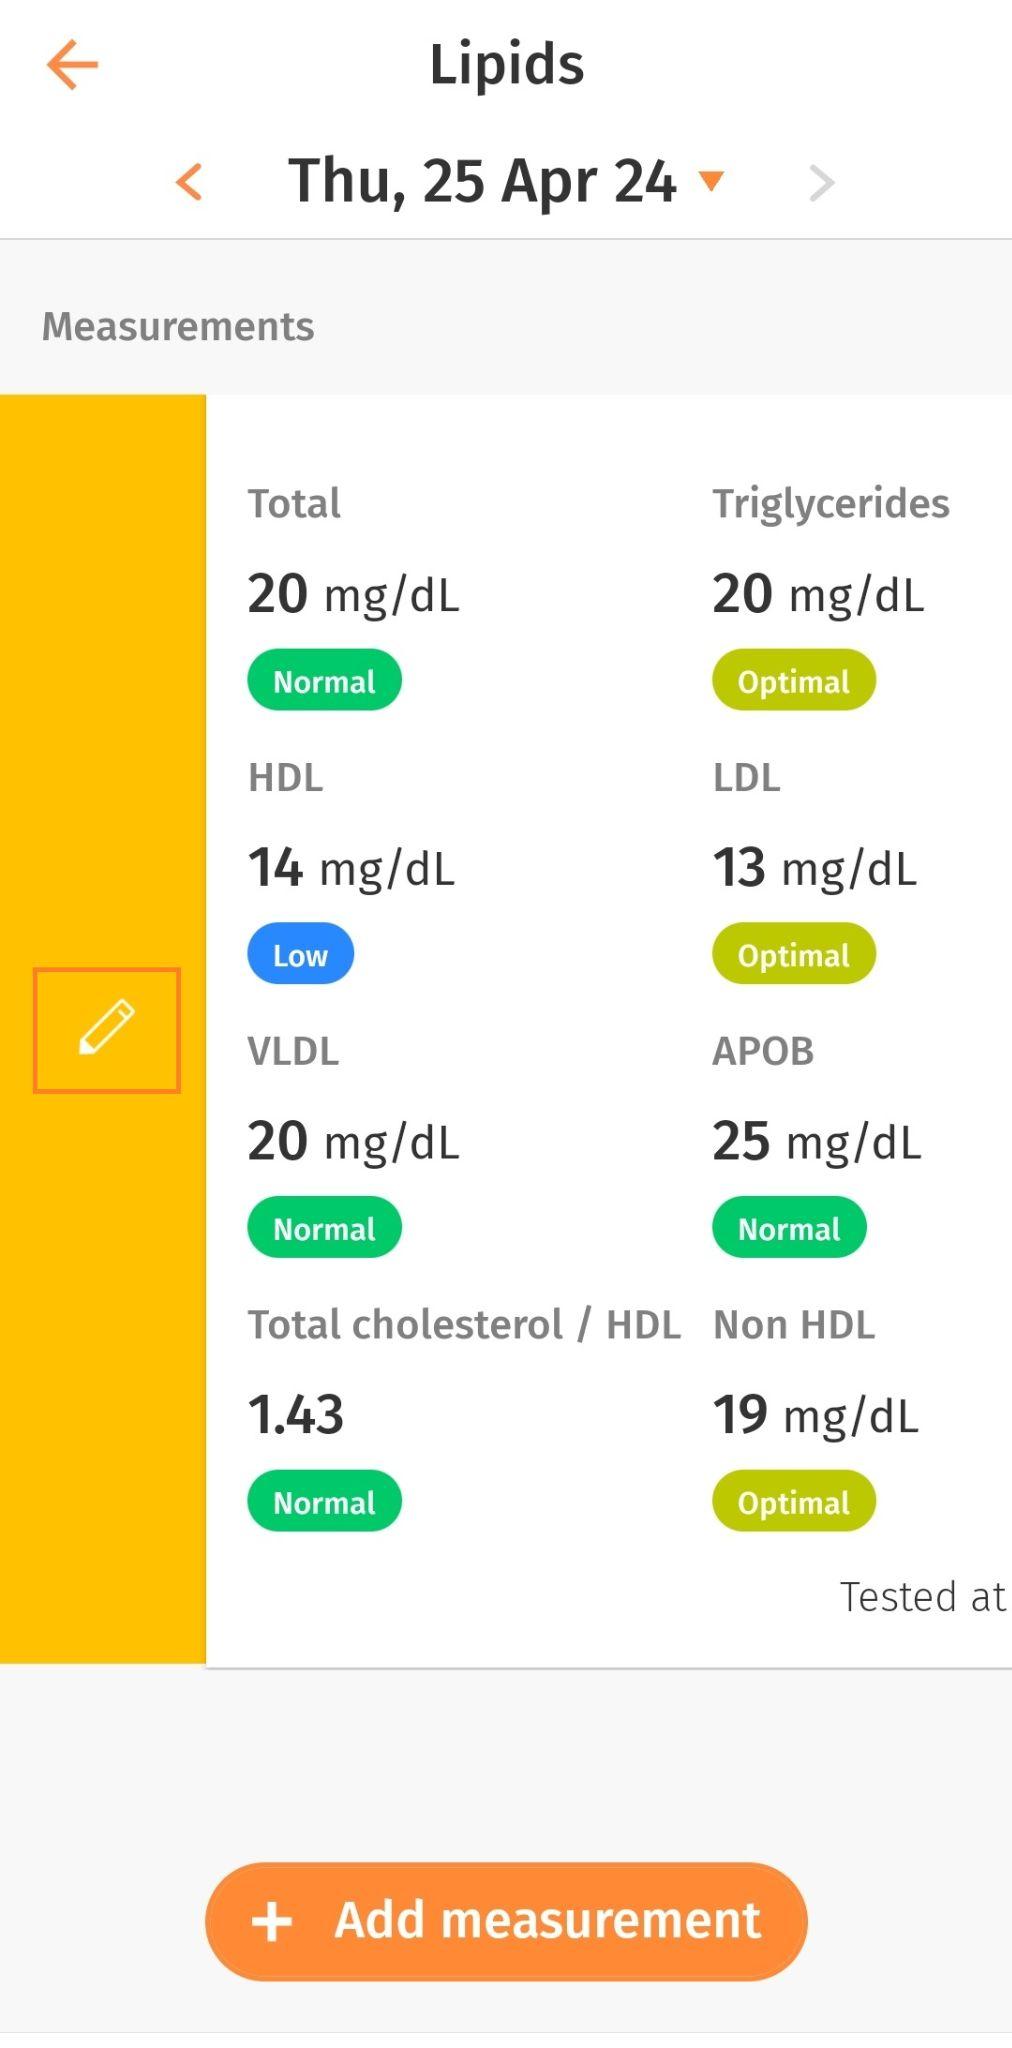
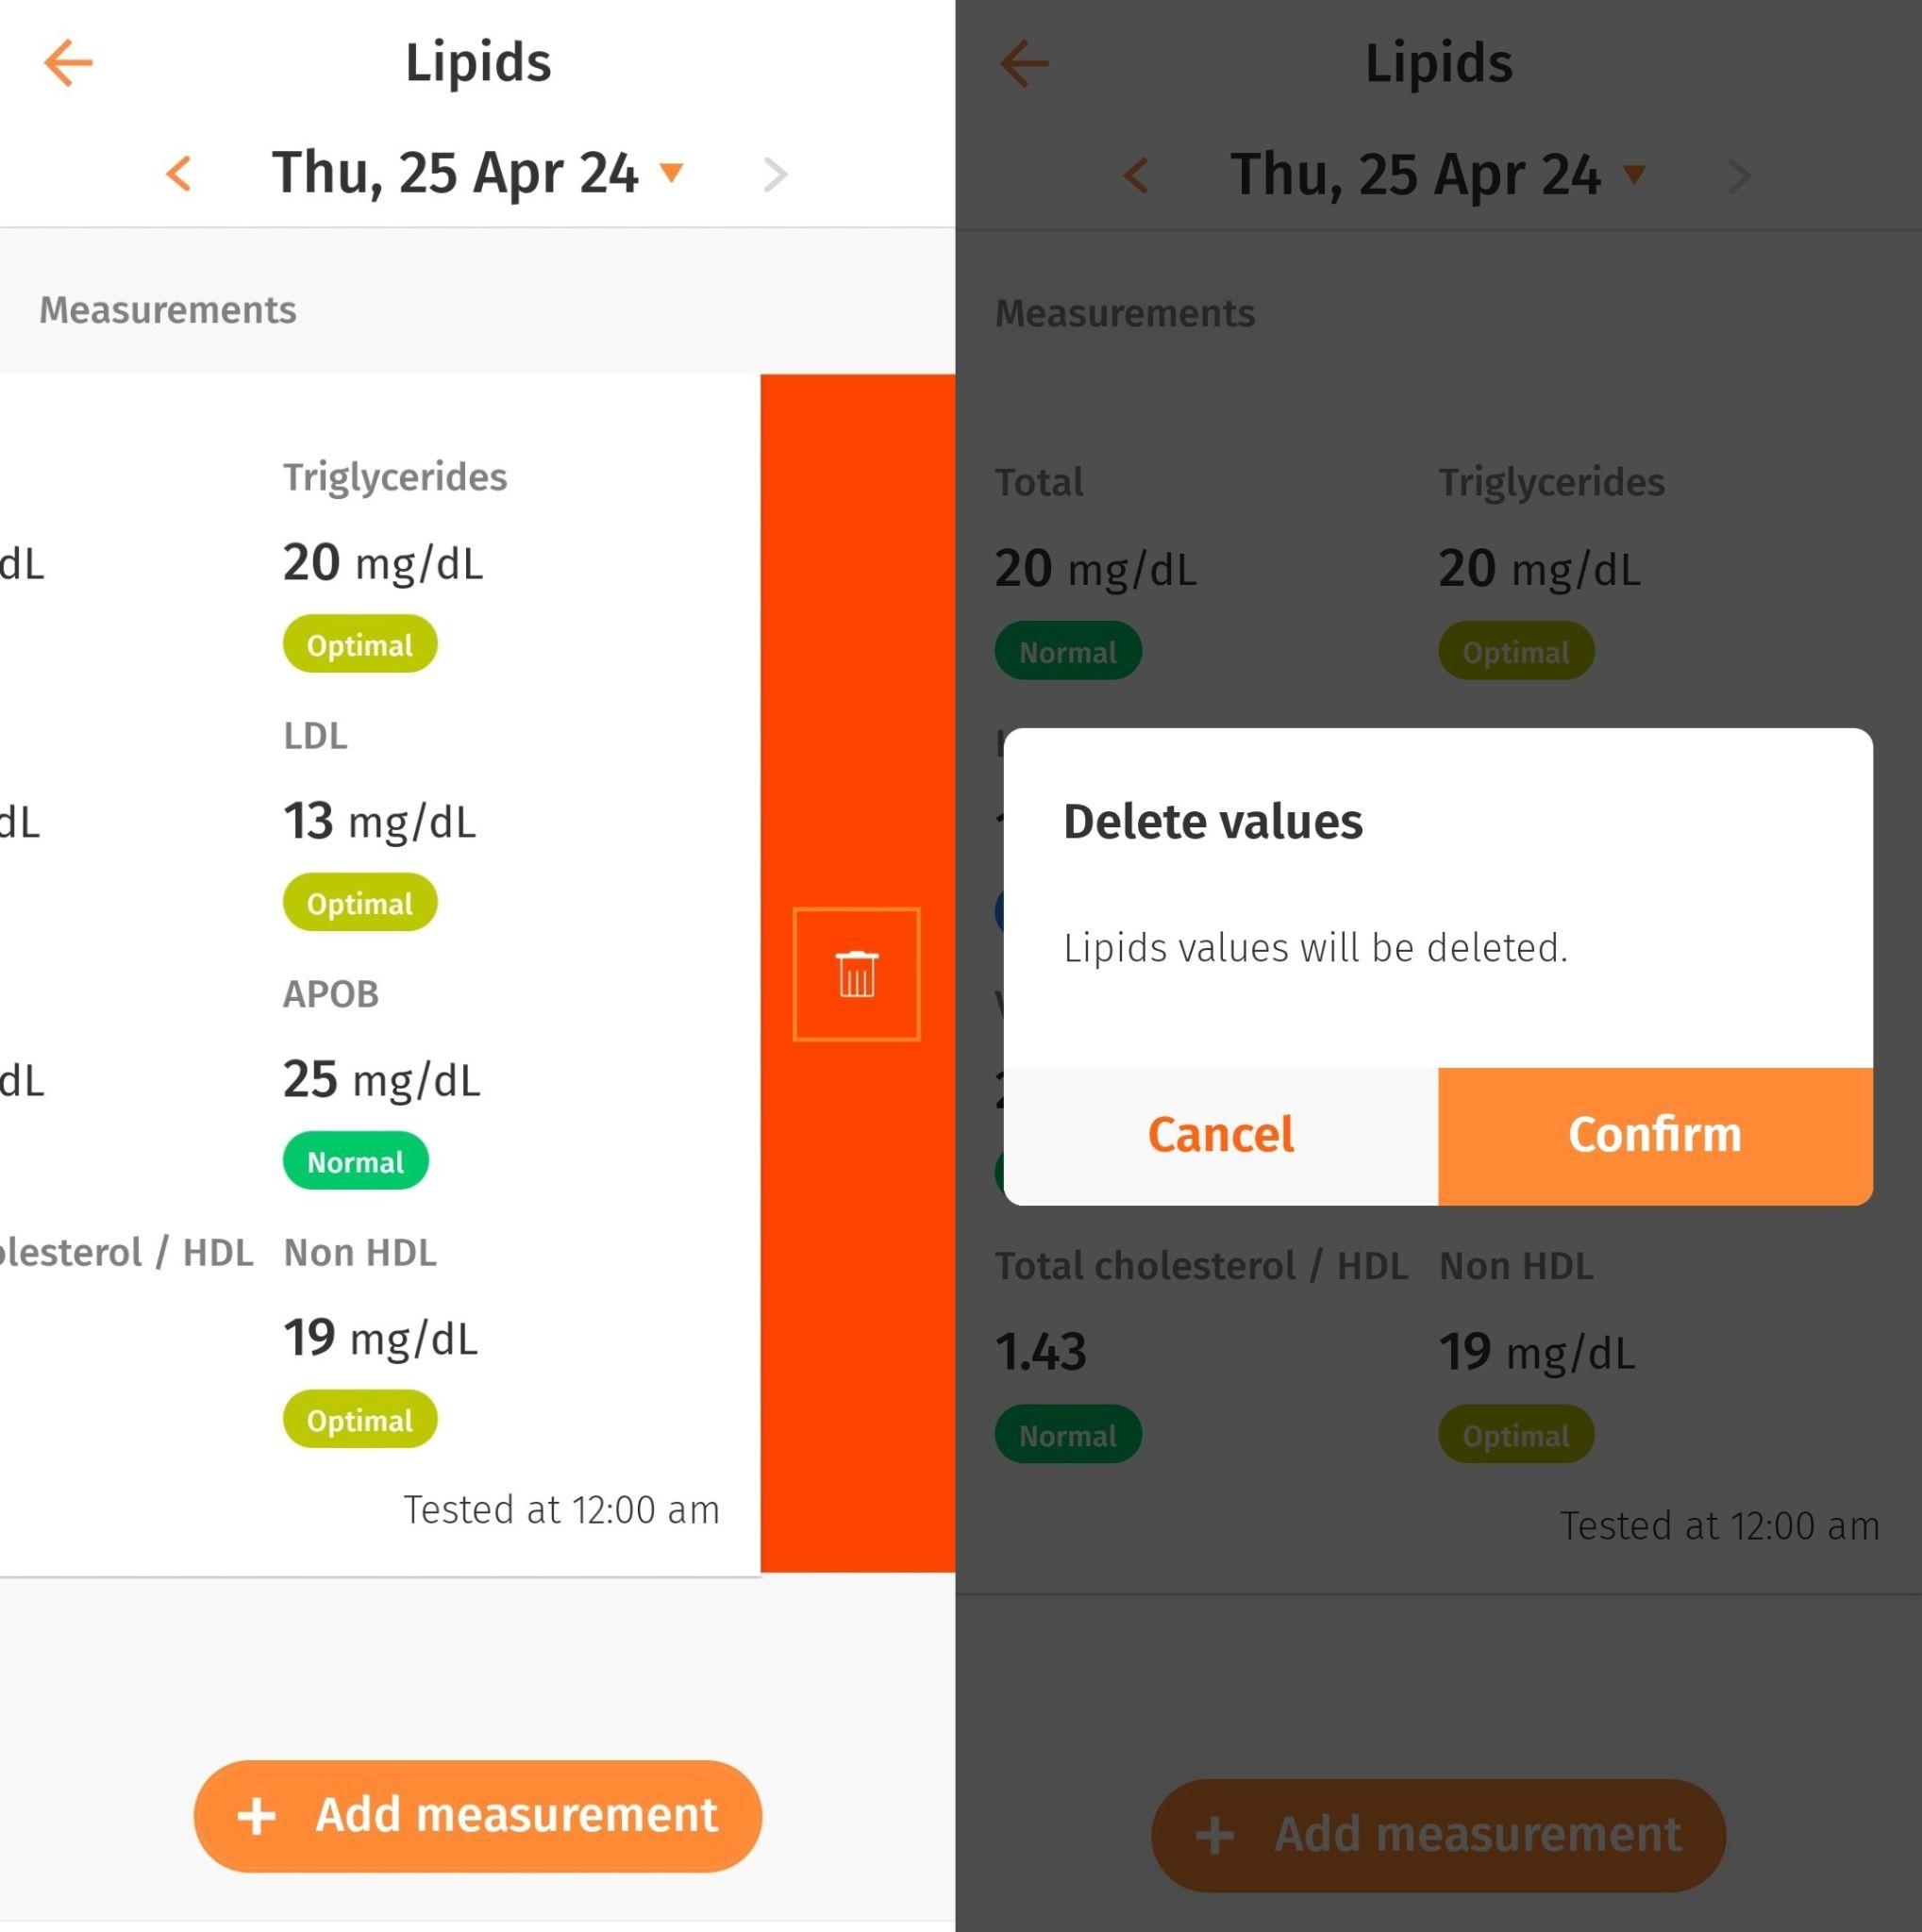
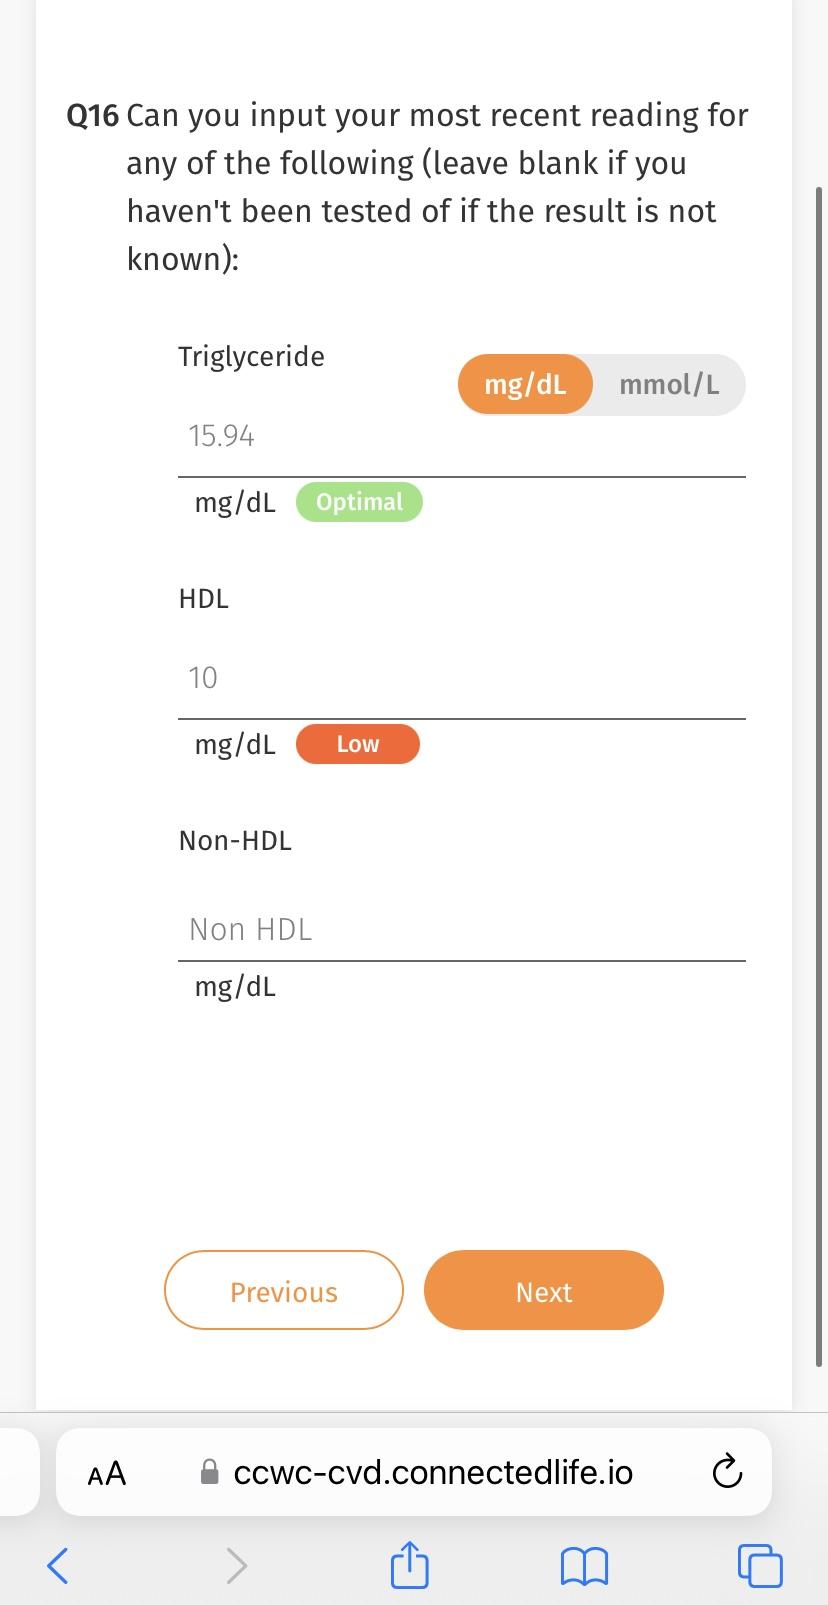
Q16. Can you input your most recent reading for any of the following (leave blank if you haven’t been tested or if the result is not known):

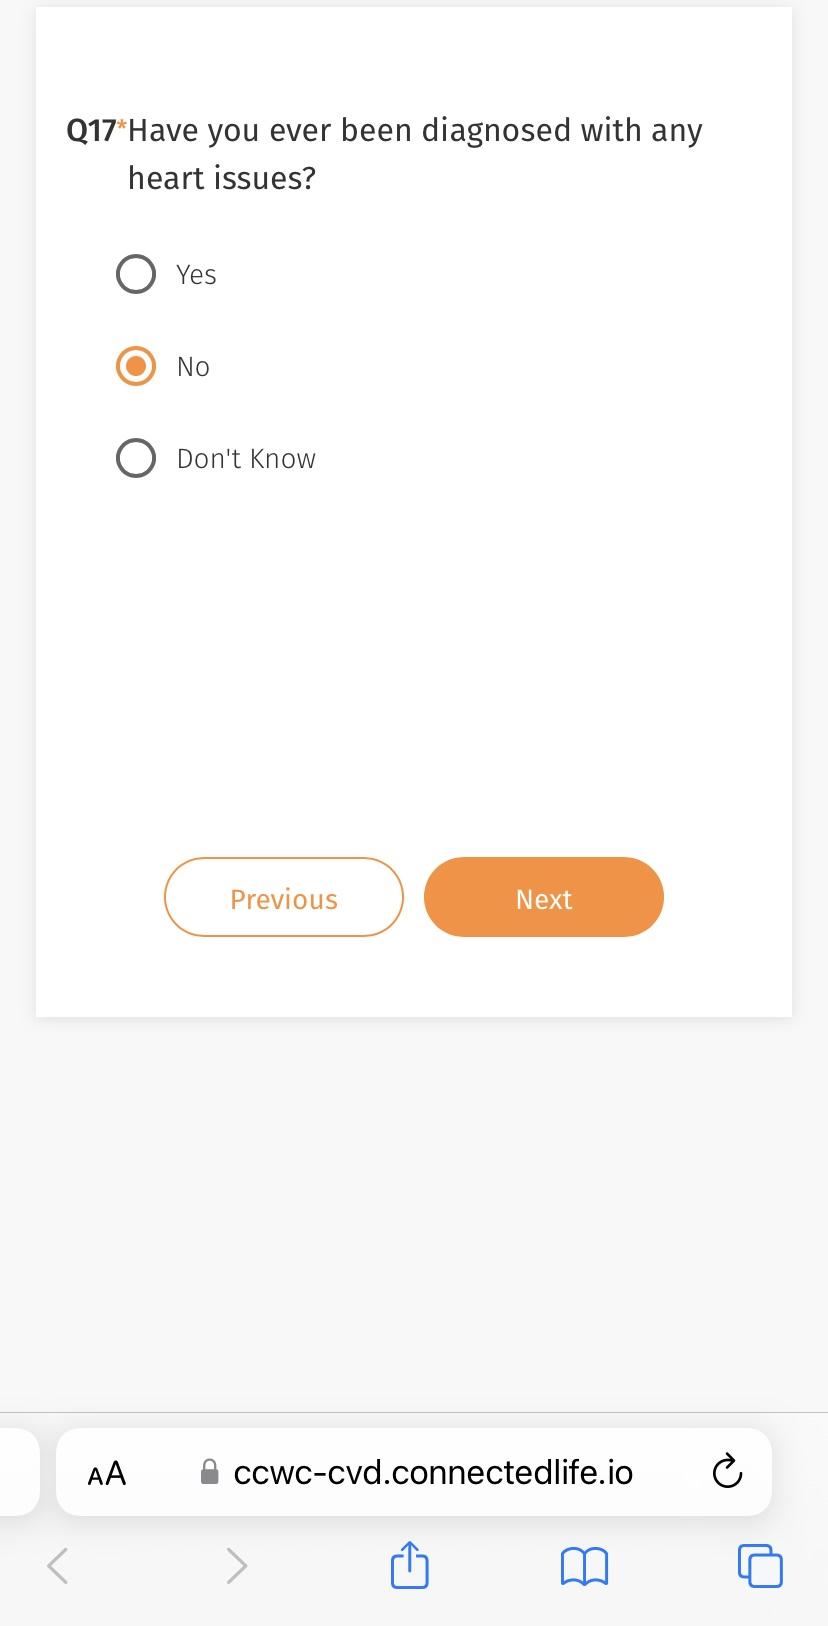
Q17. Have you ever been diagnosed with any heart issues?

Q18. Have any of your parents or siblings been diagnosed with heart issues?

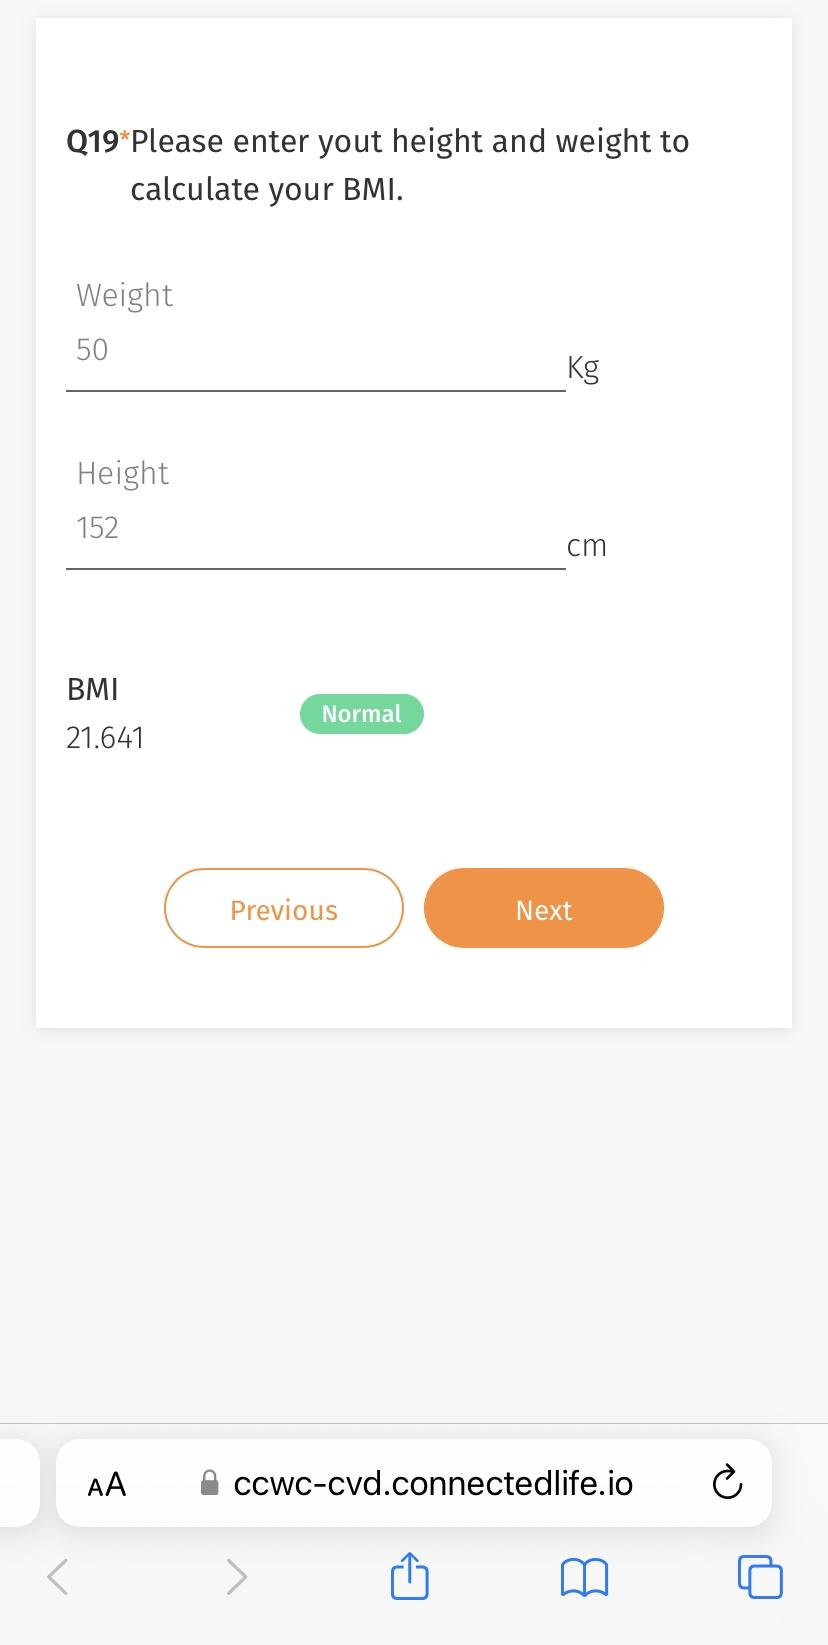
Q19. Please enter your height and weight to calculate your BMI.

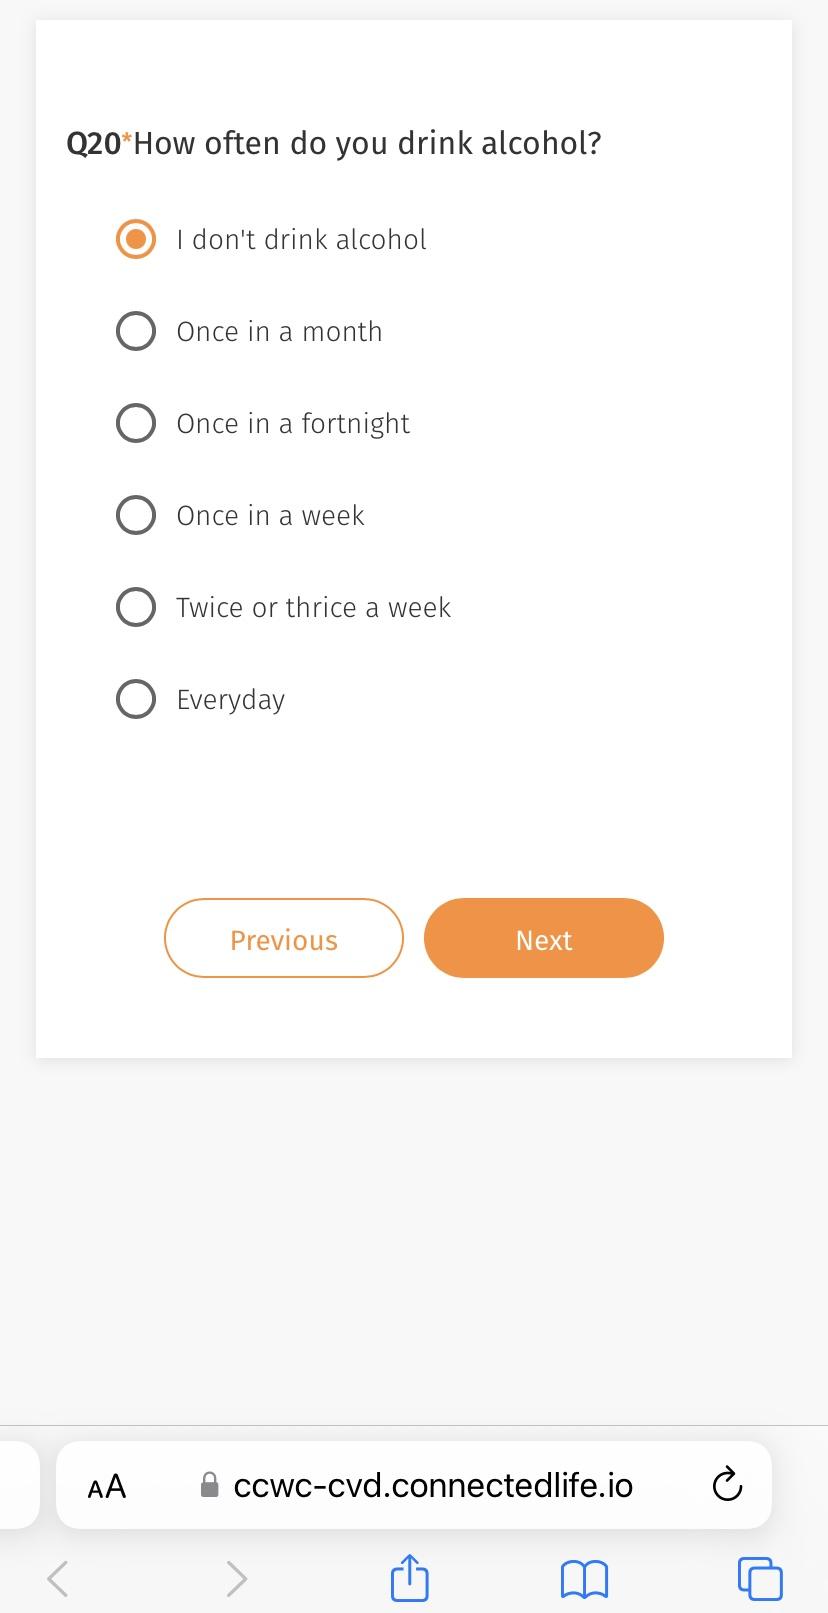
Q20. How often do you drink alcohol?

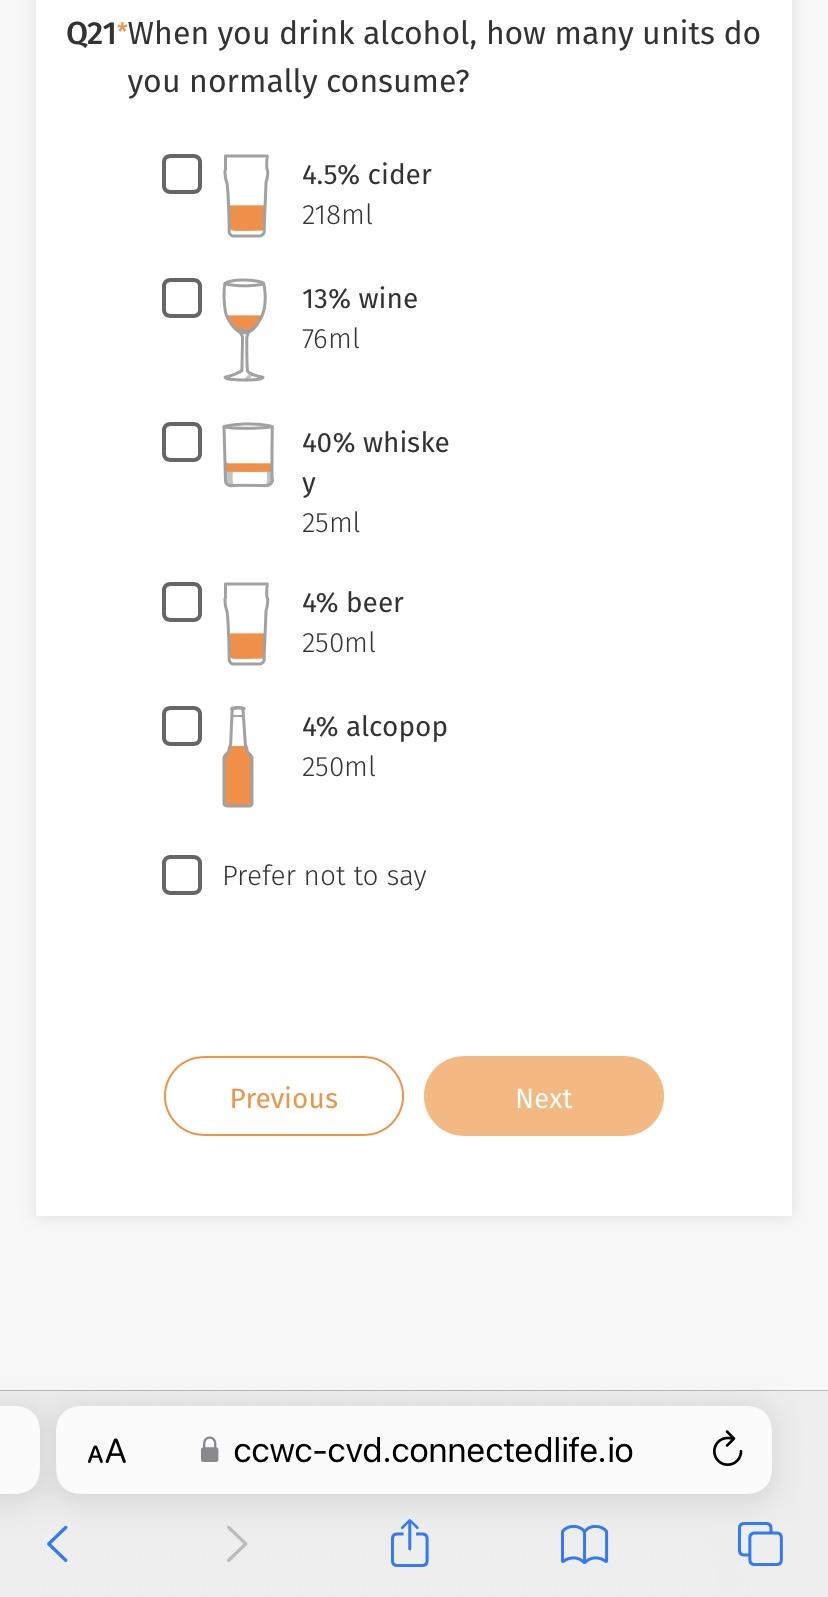
Q21. When you drink alcohol, how many units do you normally consume?

Q22. Which category of physical activity do you perform?

Click Submit.

Step 5:

The Questionnaire along with your answer will be shown here. Now, Click Continue.
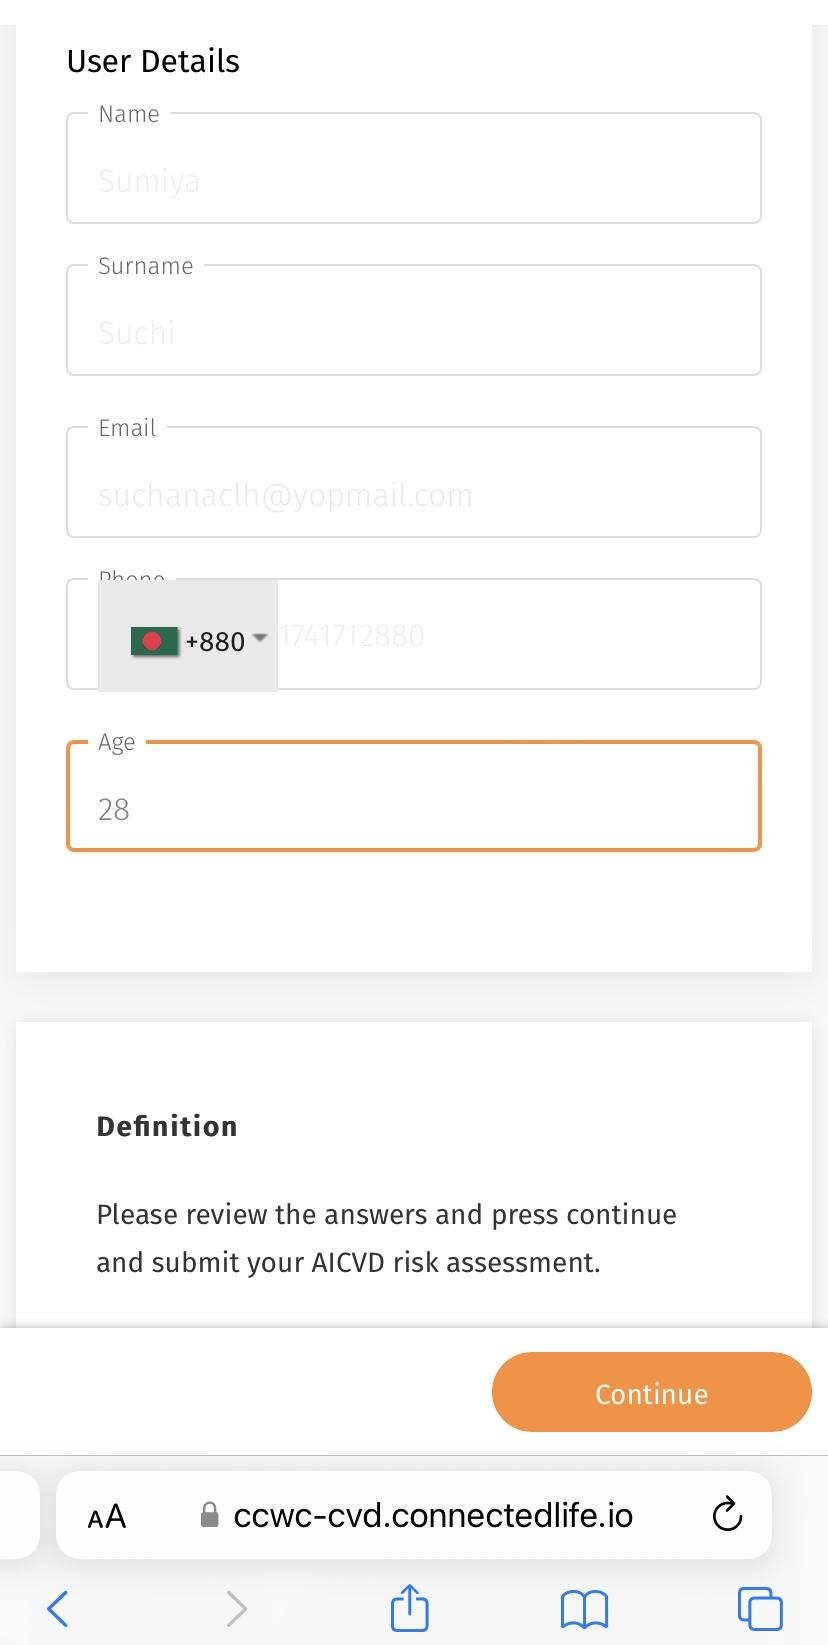
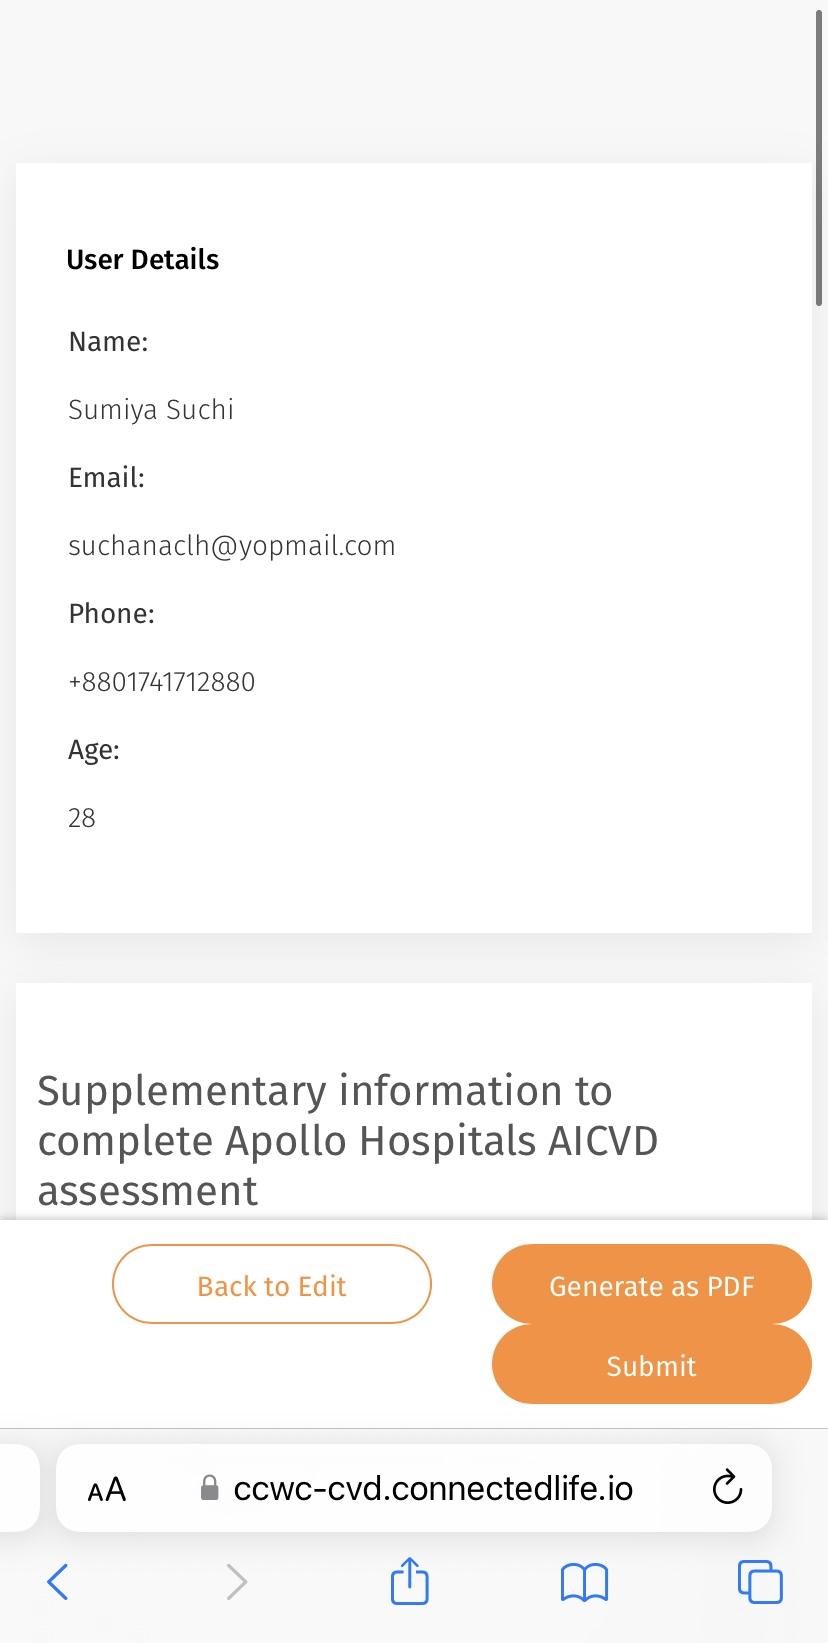
Step 6:

There will be three options, Back to edit, Generate as PDF, and Submit.

Click Submit to proceed to the next step.
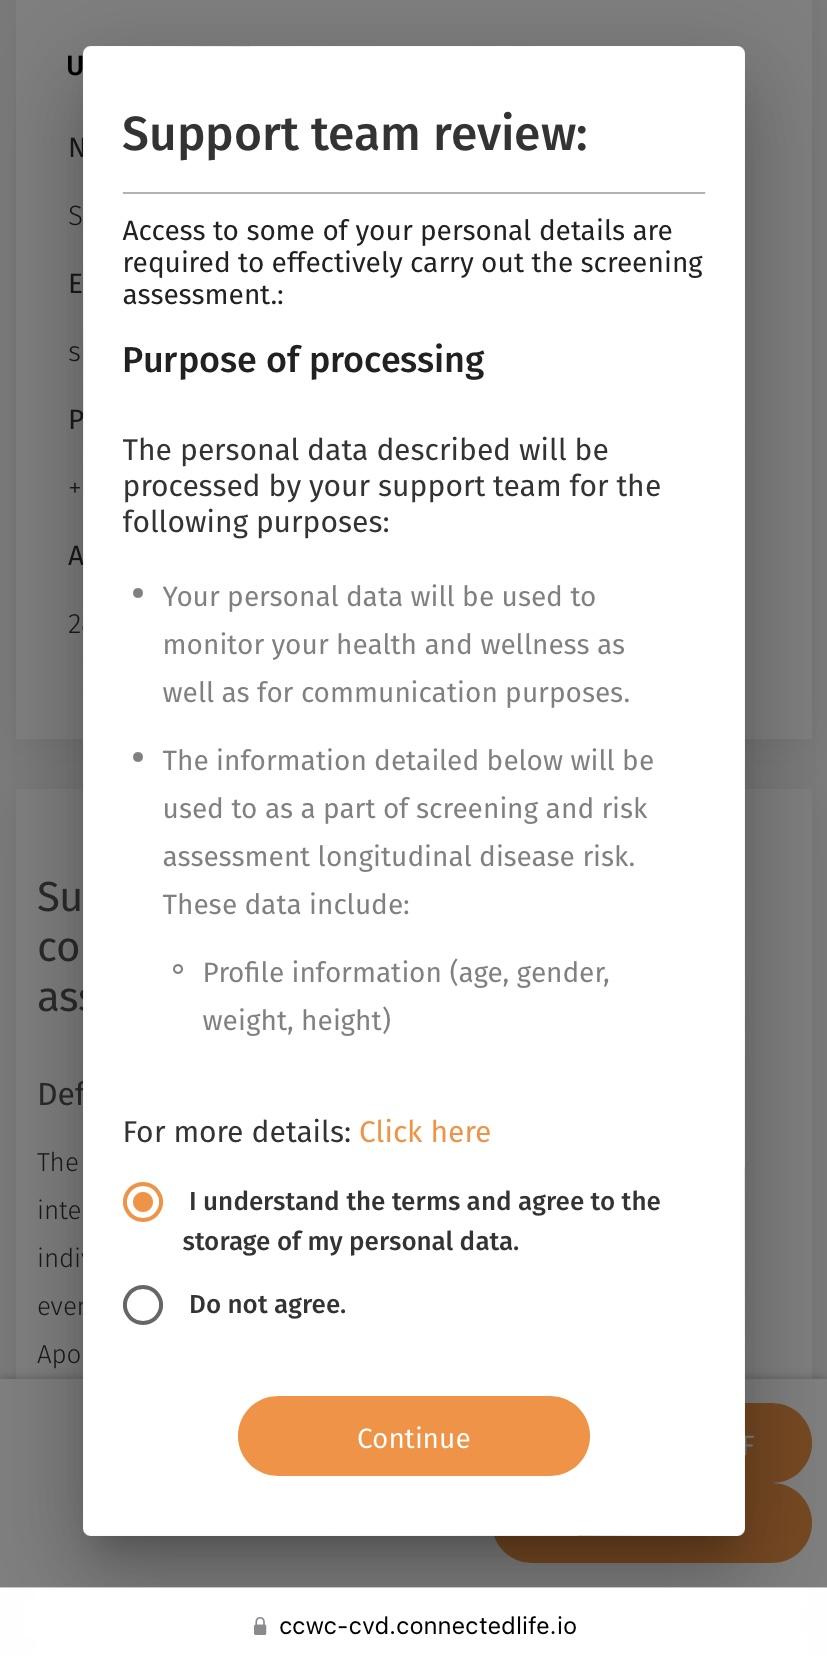
Step 7:

There will be a Support Team Review page. Click on Continue.
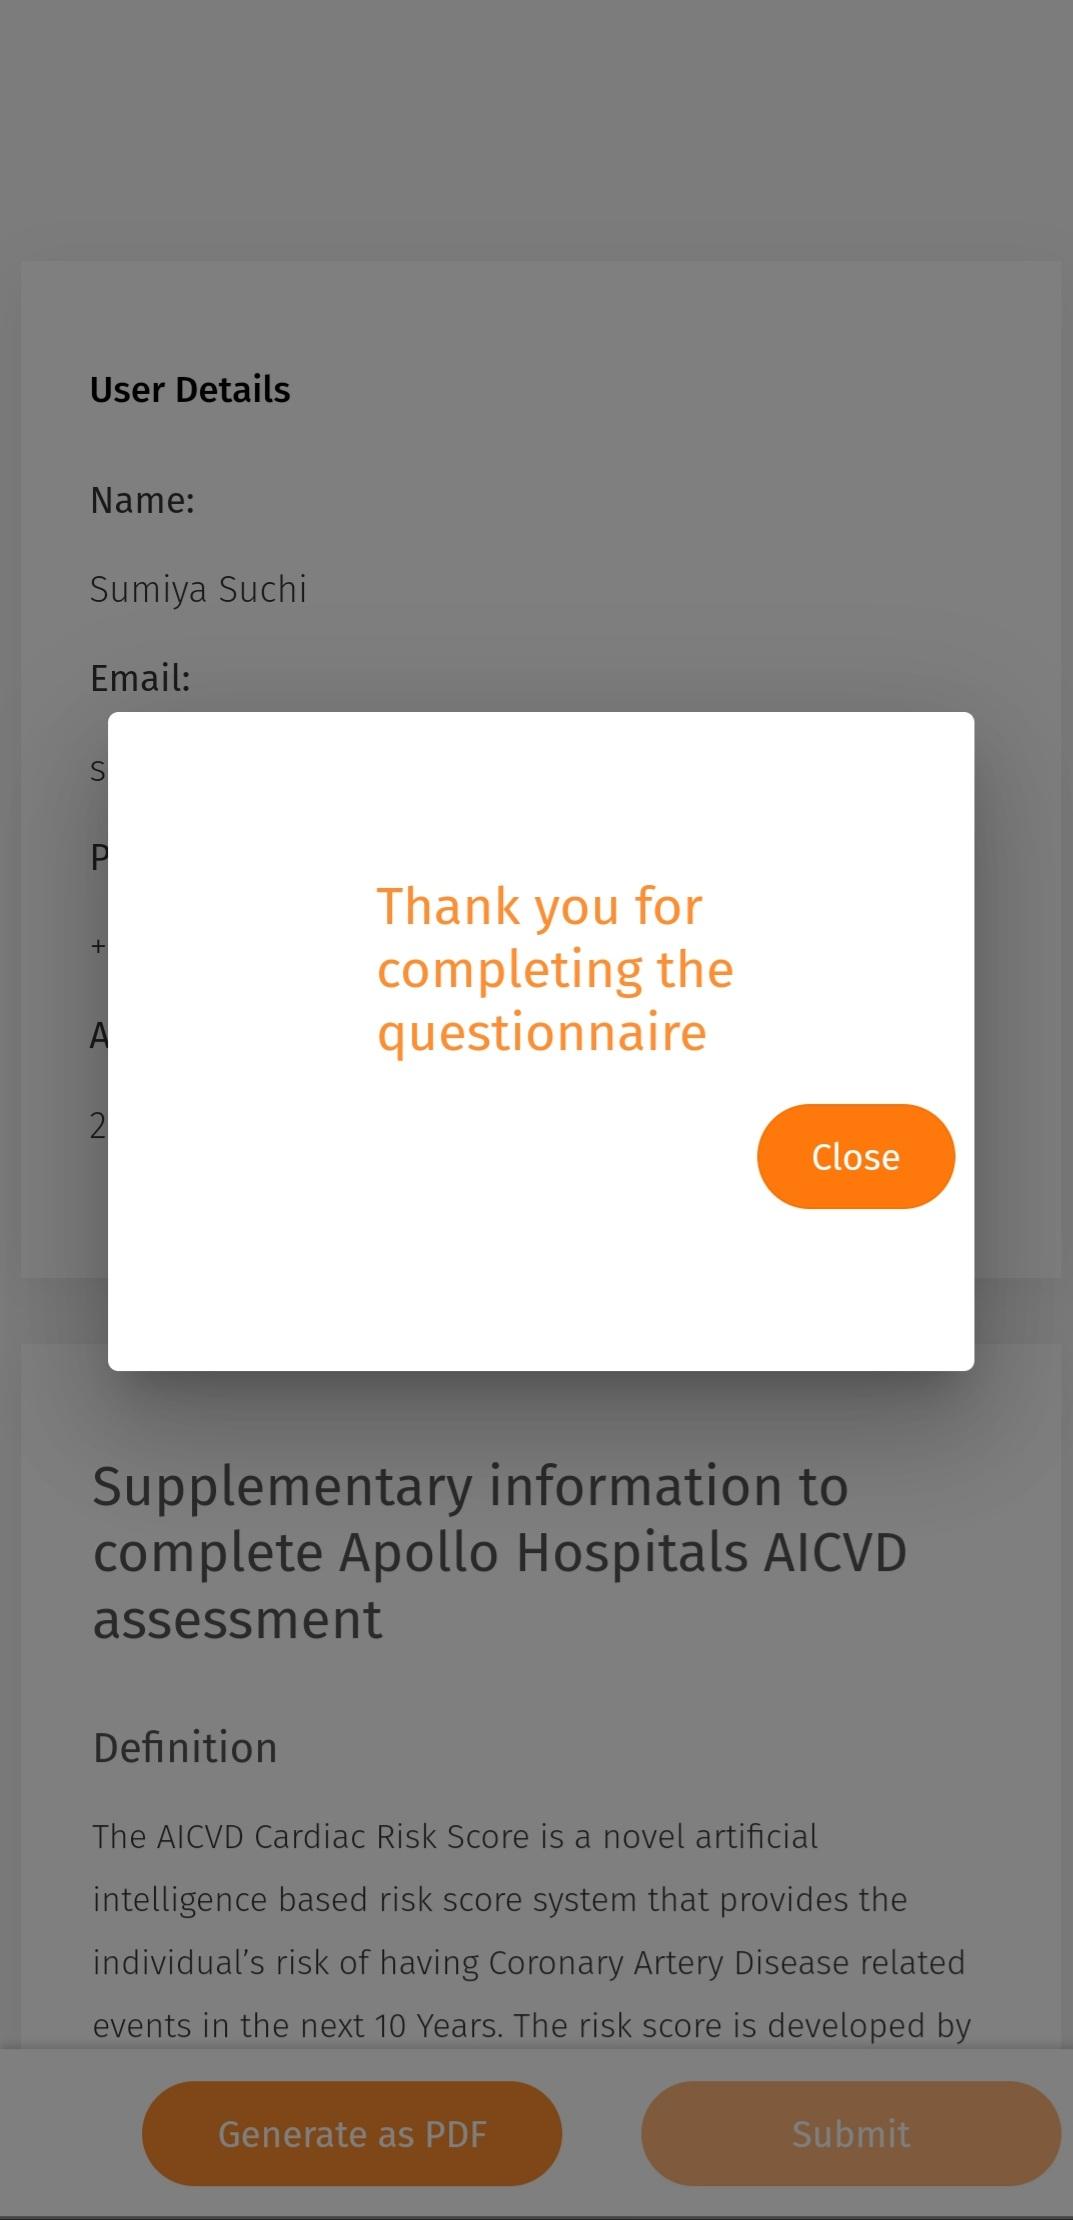
Step 8:

A pop-up will appear confirming the questionnaire is completed.

Note:

You can Submit the AICVD questionnaire from the link provided in your email following the same process from the computer.

What is Specialist section in Analysis part of the ConnectedLife App?

This section explains that you can view your self-reported record. Here you will find your medication-taking status and discomfort level and all health data.

After heading to Analysis, click Specialist.

In this section, you may see if your meds have been taken. You can also look at your “Self-Reported Discomfort” record.

All Health Data: The All Health Data feature provides users with comprehensive graphical representations of their health records over a specific period, offering a detailed overview of their health status.

Tip: You can record your discomfort level in your Fitbit watch.


What is Wellness Plus Section in Analysis part of the ConnectedLife App?

In this article, you will learn about the ConnectedLife App’s Wellness Plus Section in Analysis.

Open the app and select Analysis.

Wellness Score

The Wellness Score was developed as a motivating tool for people to get healthier and feel better. It highlights any health concerns and acts as a warning as well. The patient’s submission of information from their schedule screen and the activities the wearable device records provide the wellness statistics. Pressing any area of the wellness score will display that specific health segment.

Onboarding average: The score displayed that was recorded throughout the first seven days of onboarding.

Today: This one represents the score of the day recorded.

Target: It Indicates the optimal value that you should reach in order to improve your long-term health. This target score sets a motivation for the user to their health condition.

Reference Range: It displays the status you are at now. Each color represents a different state of health. You can see quite clearly if your current number is inside or outside of the intended range thanks to the hues, which vary from orange to green.

Long-term health indicator: The percentage shows your future performance potential if you maintain your existing level of health. An outline of the patient’s data for the pertinent parameter throughout the previous 30 days is shown in the figure below.

Positive Contribution: Those areas of health are in good status.

Negative Contribution: Those areas of health need improvement.

Self-Reported Staus: This function acts as a thorough means for users to provide vital information regarding their health, allowing the Support Team Member to efficiently keep an eye on their condition.

Condition: This section allows you to view the condition. Under Condition, you will find Log which are Blood Pressure, Blood Glucose, Core body temperature, Spo2 and Vital signs from most recent sleep.

Wellness: You can view the range values obtained for Body shape, Steps, Distance, Sleep and other elements that will be captured by your smartwatch.

All Health Data: The All Health Data feature provides users with comprehensive graphical representations of their health records over a specific period, offering a detailed overview of their health status.

Tips:

  • Please wait a bit to see the Wellness Score properly.
  • Wherever the watch icon is located, you need to input those item’s data from the watch.
  • It is highly recommended that you always wear your watch, except when it is charging.

What is Analysis section in the ConnectedLife App?

It refers to a dedicated segment where users can dive into detailed insights into health, assessments, or reports of their health status. This section represents a comprehensive analysis of user activity and health metrics. Additionally, the Analysis section provides suggestions for improvement, views wellness scores, and integrates with wearable devices to enhance the accuracy of health data.

It consists of two parts – Wellness Plus and Specialist.

Let’s take a closer look at the ConnectedLife App’s Analysis section.

Open the app and select Analysis.

Wellness Plus

Wellness Score

The Wellness Score is a tool designed to motivate individuals to improve their health by highlighting health concerns and warnings based on their schedules and activities.

It has several elements like Onboarding average, Today, Target, Reference Range, Long-term health indicator, Positive Contribution, and Negative Contribution.

Self-Reported Status: Self-reported status acts as a thorough means for users to provide vital information regarding their health, allowing the Support Team Member to efficiently keep an eye on their condition.

Condition: Detail records of Log.

Wellness: The data related to those factors that your smartwatch will record.

All Health Data: The All Health Data feature provides users with comprehensive graphical representations of their health records over a specific period, offering a detailed overview of their health status.

Specialist

Navigate to the Specialist part from the Analysis section.

In this section, you can find whether your medications are taken or not.

You can also view your “Self-Reported Discomfort” record.

All Health Data: The All Health Data feature provides users with comprehensive graphical representations of their health records over a specific period, offering a detailed overview of their health status.

You can record your discomfort level in your Fitbit watch.

Tips:

  • Please wait a bit to see the Wellness Score properly.
  • You can keep your record of discomfort level from the app.
  • Wherever the watch icon is located, you need to input those item’s data from the watch.
  • It is highly recommended that you always wear your watch, except when it is charging.
  • Keep updating your data regularly.

How to log Lipids in ConnectedLife App?

You will gain knowledge of how to log lipid data from this article.

  • Proceed to the ‘Log’ section on the Home screen and choose ‘Lipids.’ Tap “Add measurement.” Select testing time, then fill the values, and select the ‘Save’ button. You can input the values in mg/dL or mmol/L.

  • Once saved, your measurement will appear in the ‘Blood Pressure’ section of the app. The blood pressure system will determine and assign a blood pressure status (normal, optimal and low) accordingly.

Additionally, you can edit the existing Blood Pressure by Swiping right.

And swipe left to delete. A confirmation pop-up will appear before confirm delete. Click Confirm.

Note: Please fill up your measurements accurately to get an accurate Wellness Score.


How to log Sp02 & PR bpm in ConnectedLife App?

The instructions in this article will assist you in entering your Sp02 & PR bpm into your ConnectedLife App.

  • Sign in to the app first. Go to the “Log” section on the Home screen and choose Sp02 & PR bpm. Select “Add measurement.” Enter Oxygen Saturation (Sp02) and Pulse Rate (PR bpm). Click “Save.”

  • Your measurement will show up in the app’s “Sp02 & PR bpm” section after it has been saved.

  • Additionally, you can edit the existing Sp02 & PR bpm by Swiping right.

  • And swipe left to delete. A confirmation pop-up will appear before confirm delete. Click Confirm.

Tip: Please fill up your measurements accurately to get an accurate Wellness Score.


How to log Body temperature in ConnectedLife App?

This article will help you to understand how to log Body Temperature in your profile from the app.

  • On the Home screen, go to the “Log section” of the app, and Select “Body temperature.”

  • Enter the value and Click on “Next.” Select the measurement location by clicking the Edit icon and clicking on “Save.”

The temperature will be displayed in the “Body temperature” section. The Body temperature system will determine and assign a Body temperature status accordingly.

Tip: Please fill up your measurements properly to get an accurate Wellness Score.

How to log Blood glucose & HbA1c in ConnectedLife App?

The instructions in this article will assist you in entering your Blood glucose & HbA1c into your ConnectedLife App.

  • Start by logging in to the App. On the Home screen, navigate to the ‘Log’ section and select Blood glucose & HbA1c.’ Click ‘Add measurement.’ Select the activity/time that matches your meals or workout, and then click ‘Next’ to Add Measurements.

  • Fill in the ‘Blood glucose & HbA1c’ measurements and click ‘Save.’

  • Once saved, your measurement will appear in the ‘Blood glucose & HbA1c’ section of the app. The Blood glucose & HbA1c system will determine and assign a Blood glucose & HbA1c status accordingly.

Additionally, you can edit the existing Blood glucose & HbA1c by Swiping right.

And swipe left to delete. A confirmation pop-up will appear before confirm delete. Click Confirm.

Tip: Please fill up your measurements accurately to get an accurate Wellness Score.


How to log Blood pressure in ConnectedLife App?

The instructions in this article will assist you in entering your blood pressure into your ConnectedLife App.

  • Start by logging in to the App. On the Home screen, navigate to the ‘Log’ section and select ‘Blood Pressure.’ Click Add measurement. Fill in the ‘Systolic & Diastolic’ measurements and click ‘Save.’

  • Once saved, your measurement will appear in the ‘Blood Pressure’ section of the app. The blood pressure system will determine and assign a blood pressure status accordingly.

Additionally, you can edit the existing Blood Pressure by Swiping right.

And swipe left to delete. A confirmation pop-up will appear before confirm delete. Click Confirm.

Tip: Please fill up your measurements accurately to get an accurate Wellness Score.